Market Outlook
Market Outlook
| March 2025 |
|

|
Flows of Foreign Portfolio Investor (FPI), Domestic institutional investor (DII) and other investors have been volatile in the past few weeks. Foreign Portfolio Investor (FPIs) have turned net buyers, but retail investors have turned sellers (direct basis) while still buying through MFs. This follows months of large Foreign Portfolio Investor (FPI) selling and MF buying.
On the global side, Europe is where data points are turning encouraging now. European markets have rallied by 5% over the last three months. EU and Germany have announced large fiscal spending. They intend to spend 2.2% of GDP annually over the next 10 years on defence and infrastructure. This will have a multiplier effect on the economy which should spurt GDP growth for Germany. US has been a different story. President Trump’s tariff policies is a key area of discussion. Since assuming office, Trump has announced multiple tariffs on its trading partners. This includes 20% tariff on China, 25% on some imports from Canada, 25% on steel/ Aluminium. President Trump announced that he will impose a uniform global tariff on all imports into the US from 2nd April, calling it ‘Liberation Day’. His administration is expected to enforce an across-the-board 10% tariff on all products, irrespective of origin, to either pressure countries into lowering their tariffs or generate revenue for the US economy.
The US is one of the largest trading partners of India, with bilateral trade of USD124b in CY24. Exports from India to the US reached USD81b, and imports from India to the US amounted to USD44b, resulting in a trade surplus of USD37b for India in CY24. The US is India’s largest export destination, with its share reaching 18% in CY24 from 13% in CY14 and 6% in CY06. Notably, India’s imports from the US (as a % of total imports) have remained stable at ~6% in CY24 vs. ~5% in CY14.
US selloff has deepened over past 2 weeks, yields on 10-yr Treasuries slumped to the lowest since Oct’24 to 4.17%, after President Trump’s comments on a potential recession, weak consumer sentiment and weak commentary from US Airlines and Retail chains.
On the other hand, in China manufacturing activity picked up momentum, expanding at its fastest pace in a year. The official purchasing managers' index (PMI) rose to 50.5 in March 2025 from 50.2 in February 2025, while the non-manufacturing purchasing managers' index (PMI), which includes services and construction, improved to 50.8 March 2025 from 50.4 February 2025. The data signals a gradual recovery in economic activity.
On currency side, most Asian currencies traded within a tight range as fears of increased US tariffs weighed on risk appetite. However, the Japanese yen emerged as an outlier, strengthening sharply due to haven demand. The USD/JPY pair fell 0.5% to as low as 148.73 yen.
On Indian economy front, in February 2025, the Consumer Price Index (CPI) inflation rate decreased to 3.6%, down from 4.3% in January 2025, primarily attributed to a decline in food prices. The Industrial Production (IIP) Index growth for January 2025 rose to 5%, compared to 3.5% in December 2024, reflecting an upturn in the manufacturing sector. Additionally, the Wholesale Price Index (WPI) for February 2025 increased to 2.38%, up from 2.31% in January 2025, driven by higher fuel and power costs. The Manufacturing PMI for March 2025 improved to 58.1 compared to 56.3 in the previous month, indicating a quicker increase. Both monetary and fiscal strategies have shifted to encourage domestic spending and liquidity.
Both monetary and fiscal strategies have shifted to encourage domestic spending and liquidity. In the FY26 Union Budget, India’s Finance Minister showcased the government's approach to boost consumption by allocating INR1 trillion in planned savings for taxpayers.
India’s economic challenges might have troughed and trends in some key metrics indicate that the outlook is improving GDP grew at 6.2% in 3QFY25, picking up from the 5.6% lows of 2QFY25; (2) Food inflation has come off sharply over the last few months to 3.8% in Feb’25.
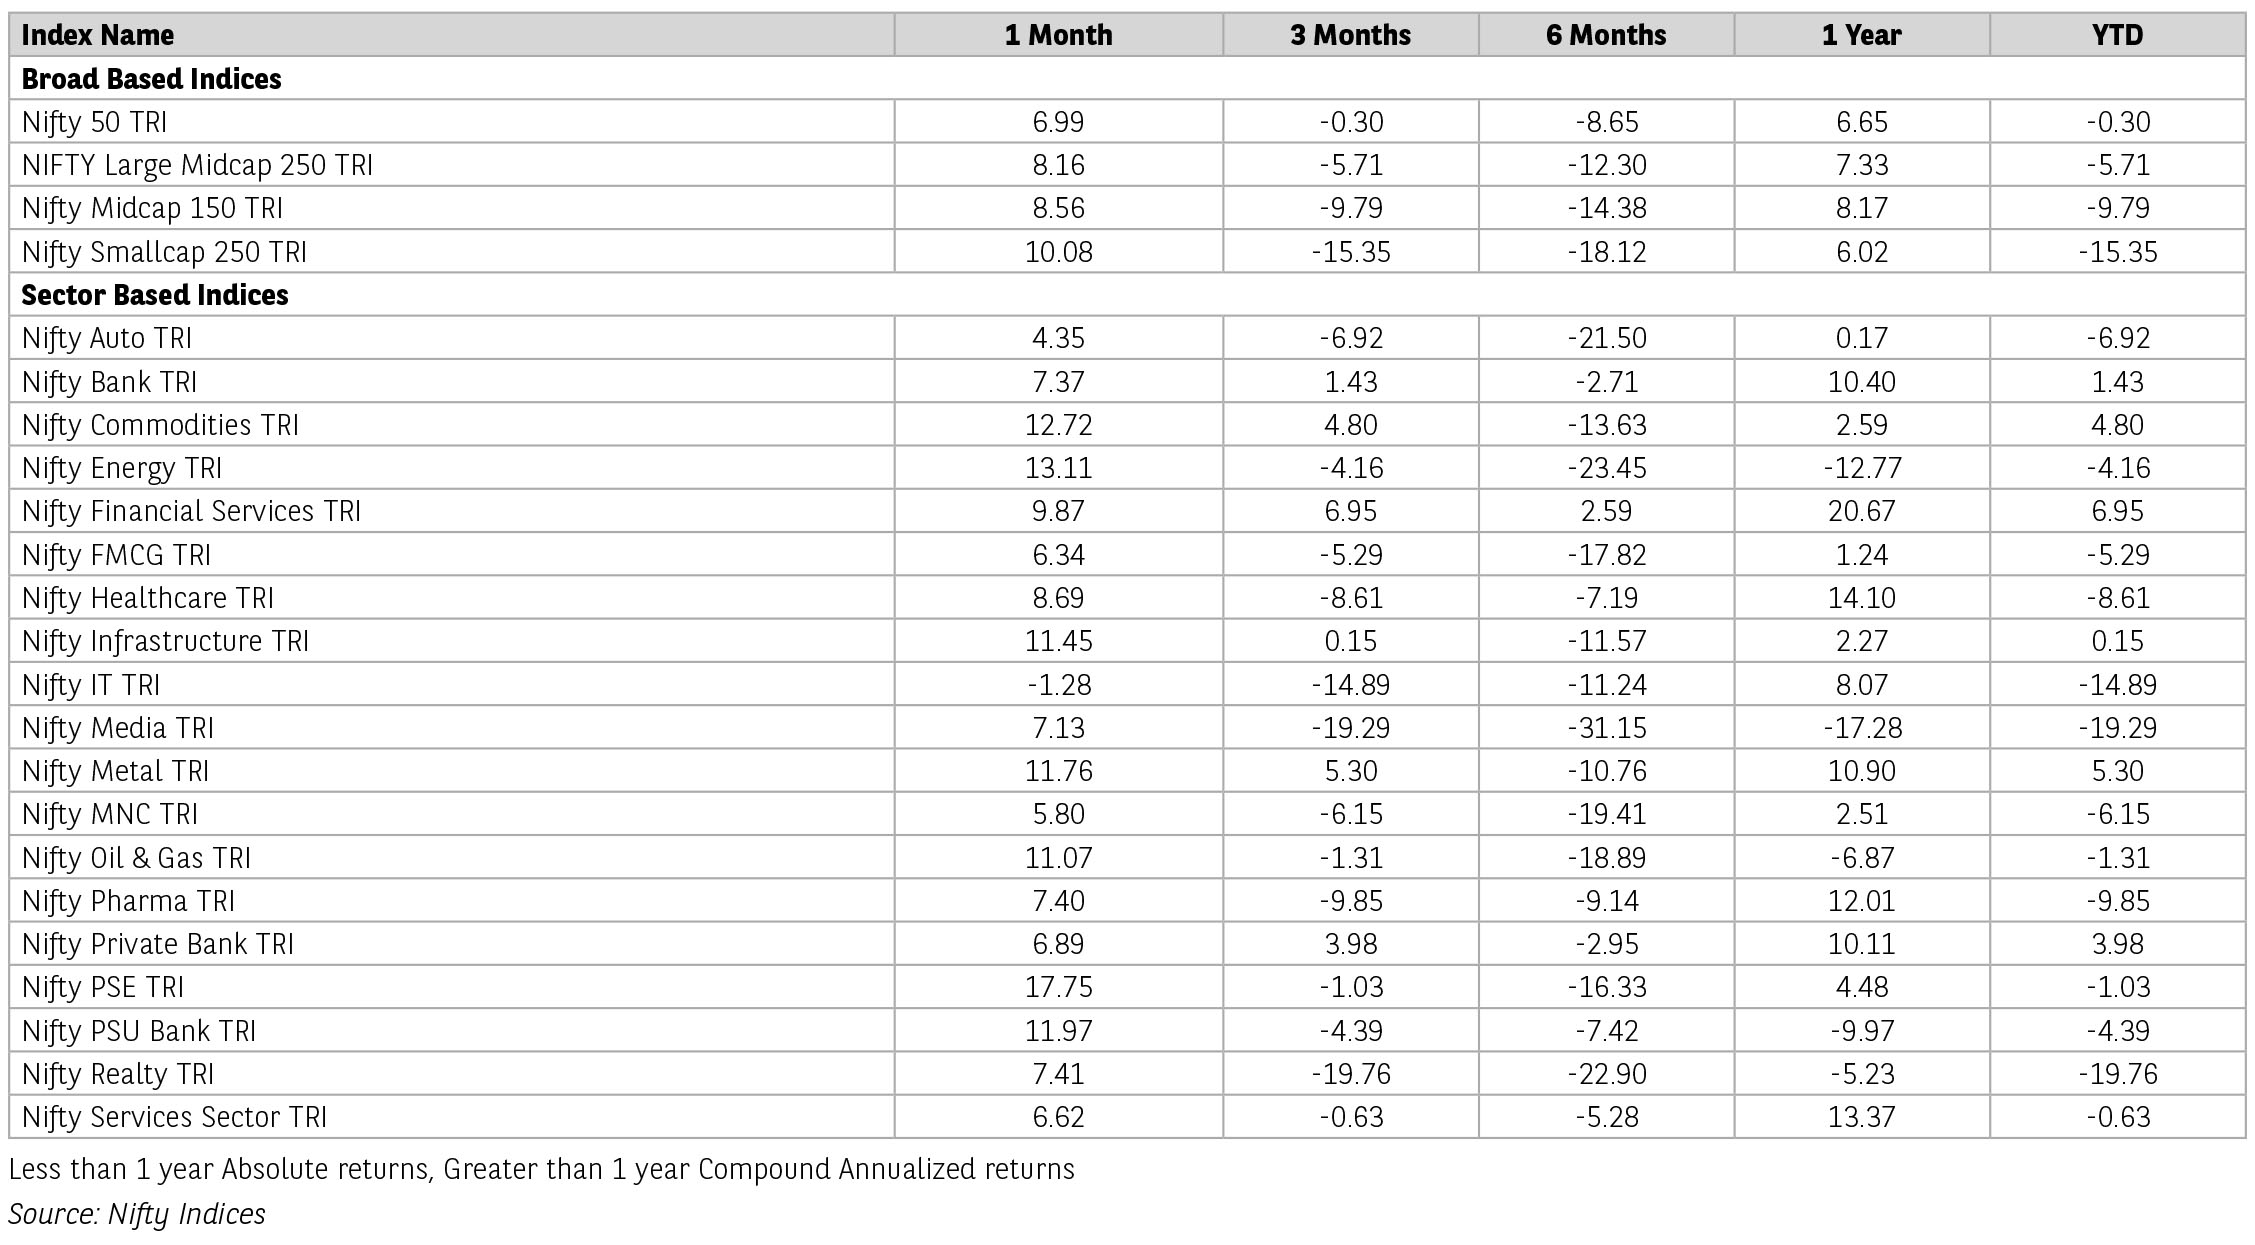
Index has corrected by 8.8% over the last six months with valuations now in line with ten-year averages. Earnings are likely to improve considering a low base and impact from higher capex and consumption allocation in budget. Key to watch would be impact of Trump tariff policies and monsoons.
Source: Kotak Securities Ltd & Incred Research. . Data as of March 28th , 2025. Kindly refer to the last page of the factsheet of Baroda BNP Paribas mutual fund for the month ending March 2025 for disclaimers.
Escalating trade tensions have been swinging the world on an uncertainty around the plausible impact of the tariffs. The concerns are on its immediate impact on world growth and inflation. Directly making the policy makers walk through eggshells trying to balance rising prices and currency depreciation.
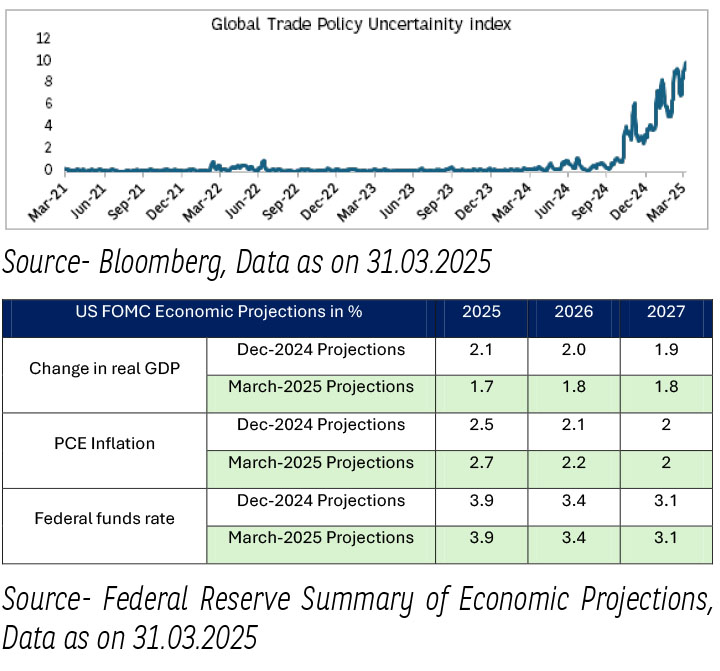
The Fed kept its policy rate unchanged at 4.25-4.5%. The pace of balance sheet unwinding reduced to $40 bn per month from $60 bn. The March-25 economic projections reflected shift in inflation estimates on the upside. Whereas growth estimates were revised downwards. Fed Chair Powell stressed the high degree of uncertainty on activity and inflation outcomes but argued that economic parameters were shifting so slowly. The key message in the policy was to wait and watch, aligning with their pause on fed fund rate both on action and projection. Adding to this is the uncertainty around tensions between Russia and Ukraine, with significant implications on oil market as US threats to impose sanctions as high as 50%. Trade and geopolitical tensions have kept the global markets volatile.
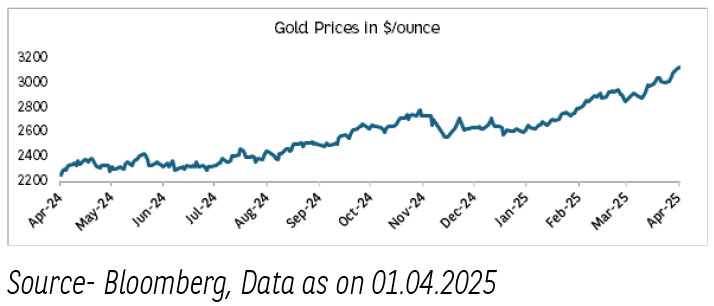
The true winner amongst the major asset classes is gold. With gold prices touching a new high of ~$3130, rising by ~37% y/y as on April 1st, 2025. Escalating tensions between Russia Ukraine and US sanctions threats on Russian oil is visible in rising brent prices. Brent prices have increased to 74$/bl from their low of 69$/bl in March-25.
Looking at Asian Economies, recent growth pickup in China offsets some of the growth uncertainty with pickup in China’s demand to offset some of the tariff related negative effects on global production.
Domestic Economy-
Amidst volatile external environment, Indian economy continues to demonstrate resilience supported by sectoral performance and improving consumption trends. The Indian economy recorded a sequential pick-up in growth during Q3:2024-25 driven by private consumption and government spending. High frequency indicators suggest that aggregate demand continued to remain resilient in Q4:2024-25. Tractor sales registered double-digit growth for the third consecutive month. The economic indicators show moderation in growth in certain sectors and not across the board.
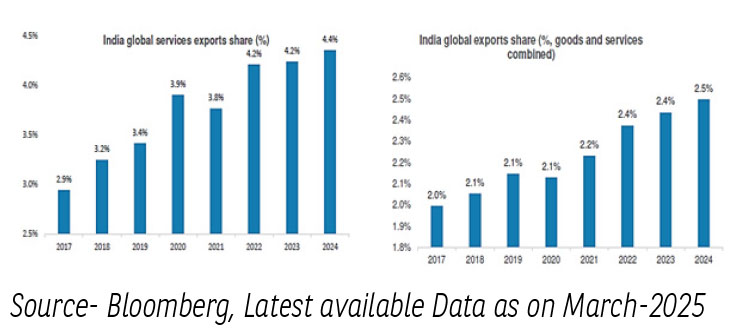
Despite headwinds to global trade and world demand, exports recorded a growth of 10.4%, primarily supported by services. With growth in exports surpassing that of imports, the net exports contributed positively to GDP growth by 2.5% in Q3:2024-25.
Government Borrowing- H1 FY26 –
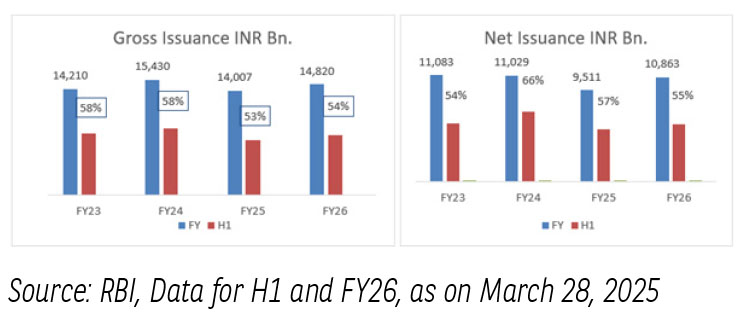
The government has pegged H1FY26 gross g-sec borrowing at INR 8trn, which is 54% of full year borrowing. Similar to the issuance pattern year (H1FY25 actual issuance was 53% of full year). The issuances at 10 year and above is at 74.9% in H1 FY26, marginally lower than 76.8% in H1 FY25.
Domestic Inflation-
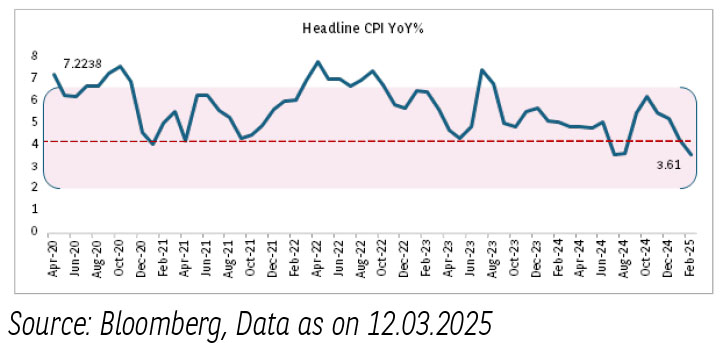
- Headline inflation has softened to 3.61% y/y in February-25 led by a continued decline in vegetable prices.
- The decline was also supported by a decrease in other food items.
- The estimate for March CPI inflation is tracking around 3.8%, after accounting for the continued decline in food prices in March-25 as well.
- The daily food price data by the department of consumer affairs indicates a further decline in vegetable, eggs, cereals, and pulses prices in first two weeks of March-25.
- The policy space to cut interest rate is supported by easing in inflation.
Domestic Liquidity –
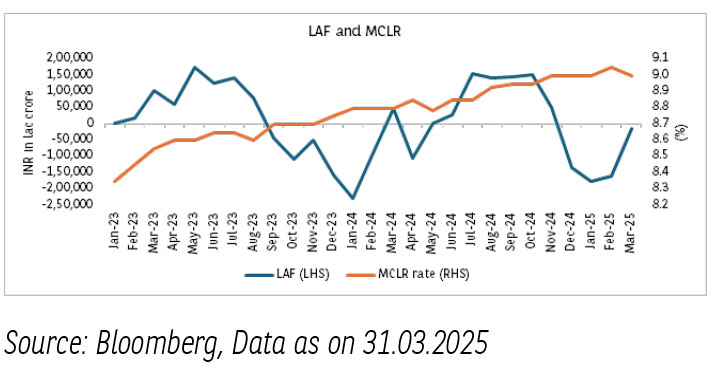
- The liquidity deficit has seen a slow decline in March-25, compared to peak deficits later this year. Banking sector liquidity in India was at a deficit of Rs130 bn on March 27 compared to deficit of Rs2.3 tn on March 20.
- RBI has been infusing substantial liquidity into the system through Open Market Operations (OMO) (primary and secondary markets), USD-INR swap operations as well as Variable repo rate(VRR)s in spirit of the monetary policy stance.
- Following the liquidity, benchmark lending rate 1-Year median Marginal Cost of Funds based Lending Rate (MCLR) declined to 9% in March 2025 from 9.05% in February 2025.
- Global monetary policy dynamics have started witnessing bumps in their path to recalibrate the monetary rates.
- Trumps tariff threats and spillovers on currencies is the existing risk that is driving the markets volatile.
- On the domestic front, evolving growth dynamics have taken center stage.
- RBI’s forward guidance and the rate cut gives us the confidence on growth supported future policy expectations.
- Recent softening in domestic inflations paves the way for RBI to take calibrated policy decisions.
- RBI has been infusing substantial liquidity into the system through Open Market Operations (OMO) (primary and secondary markets), USD-INR swap operations as well as VRRs in spirit of the monetary policy stance.
- In the H1 FY26 borrowing calendar, the amount to be borrowed in 5years segment as well as 10yr segment has gone up whereas the supply in the long bonds (30yr to 50yr) is lower versus last year.
- Having said that the overall reduction in borrowing duration is positive for bonds.
- Irrespective of the tools, liquidity measures are expected to have an impact on the short end of the curve.
- The spreads on the short end are already elevated and attractive and a rate cut going forward may compress the current spreads.
- In the light of above the fundamentals of India’s fiscal demand supply remain balanced and that is expected to maintain a downside bias on yields.
The material contained herein has been obtained from publicly available information, believed to be reliable, but Baroda BNP Paribas Asset Management India Private Limited (BBNPPAMIPL) (formerly BNP Paribas Asset Management India Private Limited), makes no representation that it is accurate or complete. This information is meant for general reading purposes only and is not meant to serve as a professional guide for the readers. This information is not intended to be an offer to see or a solicitation for the purchase or sale of any financial product or instrument. Past Performance may or may not be sustained in future and is not a guarantee of future returns.
Disclaimers for Market Outlook - Equity: The views and investment tips expressed by experts are their own and are meant for informational purposes only and should not be
construed as investment advice. Investors should check with their financial advisors before taking any investment decisions.
The material contained herein has been obtained from publicly available information, internally developed data and other sources believed to be reliable, but Baroda BNP
Paribas Asset Management India Private Limited (BBNPP), makes no representation that it is accurate or complete. BBNPP has no obligation to tell the recipient when opinions
or information given herein change. It has been prepared without regard to the individual financial circumstances and objectives of persons who receive it. This information is
meant for general reading purposes only and is not meant to serve as a professional guide for the readers. Except for the historical information contained herein, statements in
this publication, which contain words or phrases such as ‘will’, ‘would’, etc., and similar expressions or variations of such expressions may constitute forward-looking statements.
These forward-looking statements involve a number of risks, uncertainties and other factors that could cause actual results to differ materially from those suggested by the
forward-looking statements. BBNPP undertakes no obligation to update forward-looking statements to reflect events or circumstances after the date thereof. Words like believe/
belief are independent perception of the Fund Manager and do not construe as opinion or advice. This information is not intended to be an offer to see or a solicitation for the
purchase or sale of any financial product or instrument. The investment strategy stated above is for illustration purposes only and may or may not be suitable for all investors.