We are upgrading our transaction portal and will be back soon.
AUM
₹ 173.49 Crores
Benchmark
*Investors should consult their financial advisers if in doubt about whether the product is suitable for them
CRISIL Credit Risk Debt B-II Index
Inception Date
23-01-2015
Expense Ratio (Base)
1.49%
As on 15-04-2025
Corporate Bond
Government Securities/State Development Loans
Cash & Cash equivalents
REITs/InvITs
AA: 59.20
A1+/AAA/Sovereign: 27.40
AA-: 5.50
Cash & Cash equivalents: 4.40
REITs/InvITs: 3.50


Scheme Name
Returns
Investment Value
Total Amount
Withdrawn
Corpus Balance
SWP Period
Fund BARODA BNP PARIBAS ELSS Tax Saver Fund - Regular - Growth Option
Frequency Monthly
SIP Start Date 05-01-2006
SIP End Date 01-01-2025
Invested Amount ₹22,80,000.00
Current Value ₹1,03,86,141.98
Scheme Returns 14.17%
Benchmark Returns 14.12%
TER (Total Expense Ratio) 2.2%
The primary objective of the Scheme is to generate returns by investing in debt and money market instruments across the credit spectrum. However, there can be no assurance that the investment objectives of the Scheme will be realized. The Scheme does not guarantee/indicate any returns.
Entry Load :Not Applicable
Exit Load: If units are redeemed upto 10% of the units, on or before one year from the date of allotment: Nil.
If units are redeemed over and above the 10% limit, on or before one year from the date of allotment: 1% of the applicable Net Asset Value (NAV).
If units are redeemed after one year from the date of allotment: Nil. No exit load will be charged for Income Distribution cum capital withdrawal option reinvestment units. Transaction charges, if applicable, shall be deducted. The above mentioned load structure is also applicable to SIP investments.
Lumpsum Details:
Minimum Application Amount: ₹ 5,000 and in multiples of ₹ 1 thereafter.
Minimum Additional Application Amount: ₹ 1,000 and in multiple of ₹ 1 thereafter
(i) Daily, Weekly, Monthly SIP: ₹ 500/- and in multiples of ₹ 1/- thereafter;
(ii) Quarterly SIP: ₹ 1500/- and in multiples of ₹ 1/- thereafter. There is no upper limit
₹ 1000/Installment - 6 Installments - Frequency - Daily/Weekly/Fortnightly/Monthly/
₹ 1500/Installment - 4 Installments - Frequency - Quarterly
Withdrawal must be for a minimum amount of ₹ 1,000/- or in multiples of Re.1/- thereafter, in Weekly / Monthly SWP and ₹ 1,500/- and in multiples of Re.1/- thereafter, in Quarterly SWP.
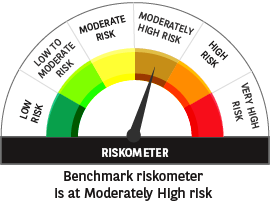
An open-ended debt scheme predominantly investing in AA and below rated corporate bonds (excluding AA+ rated corporate bonds). A Relatively High Interest Rate Risk and High Credit Risk
This product is suitable for investors who are seeking*:
- Income over medium term.
- Investment in a mix of debt and money market instruments across the credit and maturity spectrum.
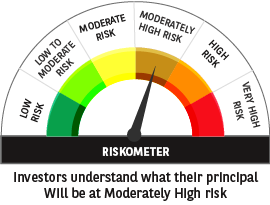
^^Riskometer For Scheme: basis it's portfolio, For Benchmark (CRISIL Credit Risk Debt B-II Index): basis it's constituents; as on March 31, 2025
*Investors should consult their financial advisers if in doubt about whether the product is suitable for them.
Information Ratio (IR) is a risk adjusted return metric which helps investors understand whether the Scheme has generated excess return over the benchmark index consistently. It is often used as a measure of a portfolio manager's level of skill and ability to generate excess returns, relative to a benchmark and attempts to identify the consistency of the performance by incorporating standard deviation into the calculation.
When a portfolio's IR is high, it indicates that it is performing well, meaning that it consistently produces risk adjusted returns. In contrast, a low IR may indicate a volatile portfolio, which means the portfolio generates less predictable returns.
As per the methodology of calculation mentioned in the circular by SEBI regarding disclosure of IR, daily portfolio return shall be calculated using arithmetic function, and the standard deviation will be calculated based on these daily return values. IR would be calculated for 1-year, 3-year, 5-year, and 10-year horizon using this methodology.
Ideally one would prefer a portfolio which earns stable returns, over one which generates less consistent returns. Information ratio becomes useful here. Consider that you need to invest in 1 of 3 portfolios – a steady growth fund A, a volatile investment B, and a fund underperforming the benchmark C. We’ll assume that the benchmark index has given an average return of 14%. Here’s how Information Ratio can help make an investment decision -
| Portfolio | A | B | C |
|---|---|---|---|
| Portfolio’s Return (1) | 17% | 20% | 12% |
| Benchmark Return (2) | 14% | 14% | 14% |
| Tracking Error (3) | 4% | 10% | 3% |
|
IR [(1)-(2)] / (3) |
0.75 | 0.60 | -0.67 |
Hence even though portfolio B has delivered better absolute returns compared to portfolio A, for a risk averse investor, portfolio A would be preferable. The example also illustrates that the IR may be negative, in the scenario that the Scheme has underperformed its benchmark.

Vikram Pamnani
Fund Manager - Fixed Income
Managing this fund since October 2022
Performance of Other Funds Managed by Vikram Pamnani
Gurvinder Singh Wasan
CFA, Fund Manager
Managing this fund since October 2024
Performance of Other Funds Managed by Gurvinder Singh WasanScheme Has One Segregated Portfolio
An open-ended debt scheme predominantly investing in AA and below rated corporate bonds (excluding AA+ rated corporate bonds). A Relatively High Interest Rate Risk and High Credit Risk
Debt
₹ 21.8312
NAV as on 15-04-2025
*Investors should consult their financial advisers if in doubt about whether the product is suitable for them

N.A.
Returns lumpsum
| Schemes (Benchmark Index) | 1 Year CAGR | 3 Year CAGR | 5 Year CAGR | |||
|---|---|---|---|---|---|---|
| Scheme Returns | Benchmark Returns | Scheme Returns | Benchmark Returns | Scheme Returns | Benchmark Returns | |
| Baroda BNP Paribas Banking and PSU Bond Fund (CRISIL Banking and PSU Debt A-II Index) | 8.44% | 7.56% | 6.35% | 6.43% | N.A.* | N.A.* |
| Baroda BNP Paribas Corporate Bond Fund (CRISIL Corporate Debt A-II Index) | 8.75% | 7.96% | 6.56% | 6.47% | 6.29% | 6.51% |
| Baroda BNP Paribas Credit Risk Fund (CRISIL Credit Risk Debt B-II Index) | 9.11% | 8.41% | 7.80% | 7.36% | 9.79% | 7.60% |
| Baroda BNP Paribas Liquid Fund (CRISIL Liquid Debt A-I Index) | 7.39% | 7.24% | 6.82% | 6.75% | 5.49% | 5.51% |
| Baroda BNP Paribas Low Duration Fund (CRISIL Ultra Low Duration Debt A-I Index) | 7.90% | 7.64% | 6.90% | 6.83% | 6.38% | 6.13% |
| Baroda BNP Paribas Money Market Fund (CRISIL Money Market A-I Index) | 7.72% | 7.37% | 6.70% | 6.94% | 5.44% | 5.83% |
| Baroda BNP Paribas Overnight Fund (CRISIL Liquid Overnight Index) | 6.65% | 6.65% | 6.30% | 6.34% | 5.04% | 5.08% |
| Baroda BNP Paribas Short Duration Fund (CRISIL Short Duration Debt A-II Index) | 8.62% | 8.06% | 7.00% | 6.55% | 6.62% | 6.33% |
| Baroda BNP Paribas Ultra Short Duration Fund (CRISIL Ultra Short Duration Debt A-I Index) | 7.48% | 7.54% | 6.82% | 6.98% | 5.79% | 6.01% |
| Baroda BNP Paribas Multi Asset Fund (65% of Nifty 500 TRI + 20% of NIFTY Composite Debt Index + 15% of INR Price of Gold ) | 8.62% | 10.83% | N.A.* | N.A.* | N.A.* | N.A.* |
| Baroda BNP Paribas NIFTY SDL December 2026 INDEX Fund (NIFTY SDL December 2026 Index) | 8.05% | 8.41% | N.A.* | N.A.* | N.A.* | N.A.* |
| Baroda BNP Paribas NIFTY SDL December 2028 INDEX Fund (NIFTY SDL DECEMBER 2028 INDEX ) | 8.92% | 9.11% | N.A.* | N.A.* | N.A.* | N.A.* |
| Baroda BNP Paribas GOLD ETF (Domestic Price of Gold) | 30.80% | 43.30% | N.A.* | N.A.* | N.A.* | N.A.* |
Period for which scheme's performance has been provided is computed basis last day of the month-end preceding the date of advertisement.
Past performance may or may not be sustained in future and should not be used as a basis of comparison with other investments. Returns do not take into account the load, if any. Returns are for growth option. Different plans shall have a different expense structure. The performance details provided above are for regular/distributor plan.
For Fund Manager(s) & Managing Since Details click here
*Where returns are not available for that particular period, they have not been shown.
| Schemes (Benchmark Index) | 1 Year CAGR | 3 Year CAGR | 5 Year CAGR | |||
|---|---|---|---|---|---|---|
| Scheme Returns | Benchmark Returns | Scheme Returns | Benchmark Returns | Scheme Returns | Benchmark Returns | |
| Baroda BNP Paribas Aggressive Hybrid Fund (CRISIL Hybrid 35+65 - Aggressive Index) | 7.25% | 7.37% | 14.85% | 11.75% | 21.00% | 18.99% |
| Baroda BNP Paribas Balanced Advantage Fund (NIFTY 50 Hybrid Composite Debt 50:50 Index) | 8.30% | 7.85% | 13.61% | 9.74% | 19.71% | 15.31% |
| Baroda BNP Paribas Banking and PSU Bond Fund (CRISIL Banking and PSU Debt A-II Index) | 8.44% | 7.56% | 6.35% | 6.43% | N.A.* | N.A.* |
| Baroda BNP Paribas Conservative Hybrid Fund (CRISIL Hybrid 85+15 - Conservative Index) | 8.04% | 8.55% | 9.09% | 8.12% | 9.97% | 9.48% |
| Baroda BNP Paribas Corporate Bond Fund (CRISIL Corporate Debt A-II Index) | 8.75% | 7.96% | 6.56% | 6.47% | 6.29% | 6.51% |
| Baroda BNP Paribas Credit Risk Fund (CRISIL Credit Risk Debt B-II Index) | 9.11% | 8.41% | 7.80% | 7.36% | 9.79% | 7.60% |
| Baroda BNP Paribas Dynamic Bond Fund (CRISIL Dynamic Bond Debt A-III Index) | 9.41% | 8.79% | 7.91% | 6.74% | 6.72% | 6.61% |
| Baroda BNP Paribas Equity Savings Fund (NIFTY Equity Savings Index TRI) | 7.87% | 7.76% | 9.92% | 8.97% | 10.93% | 12.25% |
| Baroda BNP Paribas GILT Fund (CRISIL Dynamic Gilt Index) | 9.95% | 9.91% | 7.67% | 7.64% | 6.54% | 6.67% |
| Baroda BNP Paribas Liquid Fund (CRISIL Liquid Debt A-I Index) | 7.39% | 7.24% | 6.82% | 6.75% | 5.49% | 5.51% |
| Baroda BNP Paribas Low Duration Fund (CRISIL Ultra Low Duration Debt A-I Index) | 7.90% | 7.64% | 6.90% | 6.83% | 6.38% | 6.13% |
| Baroda BNP Paribas Money Market Fund (CRISIL Money Market A-I Index) | 7.72% | 7.37% | 6.70% | 6.94% | 5.44% | 5.83% |
| Baroda BNP Paribas Overnight Fund (CRISIL Liquid Overnight Index) | 6.65% | 6.65% | 6.30% | 6.34% | 5.04% | 5.08% |
| Baroda BNP Paribas Short Duration Fund (CRISIL Short Duration Debt A-II Index) | 8.62% | 8.06% | 7.00% | 6.55% | 6.62% | 6.33% |
| Baroda BNP Paribas Ultra Short Duration Fund (CRISIL Ultra Short Duration Debt A-I Index) | 7.48% | 7.54% | 6.82% | 6.98% | 5.79% | 6.01% |
| Baroda BNP Paribas NIFTY SDL December 2026 INDEX Fund (NIFTY SDL December 2026 Index) | 8.05% | 8.41% | N.A.* | N.A.* | N.A.* | N.A.* |
| Baroda BNP Paribas NIFTY SDL December 2028 INDEX Fund (NIFTY SDL DECEMBER 2028 INDEX ) | 8.92% | 9.11% | N.A.* | N.A.* | N.A.* | N.A.* |
| Baroda BNP Paribas GOLD ETF (Domestic Price of Gold) | 30.80% | 43.30% | N.A.* | N.A.* | N.A.* | N.A.* |
Period for which scheme's performance has been provided is computed basis last day of the month-end preceding the date of advertisement.
Past performance may or may not be sustained in future and should not be used as a basis of comparison with other investments. Returns do not take into account the load, if any. Returns are for growth option. Different plans shall have a different expense structure. The performance details provided above are for regular/distributor plan.
For Fund Manager(s) & Managing Since Details click here
*Where returns are not available for that particular period, they have not been shown.
© Copyright Baroda BNP Paribas Mutual Fund
