(An open ended equity scheme following a value investment strategy)
(An open ended equity scheme following a value investment strategy)

The investment objective of the scheme is to generate long-term capital appreciation from a diversified portfolio of predominantly equity and equity related instruments by following a value investment strategy. However, there can be no assurance that the investment objectives of the Scheme will be realized. The Scheme does not guarantee/indicate any returns.
 NAV Details (As on January 31, 2025)
| Regular Plan - IDCW Option | : ₹13.4303 |
| Regular Plan - Growth Option | : ₹13.4303 |
| Direct Plan - IDCW Option | : ₹13.7651 |
| Direct Plan - Growth Option | : ₹13.7651 |
 Benchmark Index (Tier 1)
Nifty 500 TRI
 Date of Allotment
June 7, 2023
 Fund Manager
 | Fund Manager | Managing fund since | Experience |
| Mr. Shiv Chanani | 07-Jun-23 | 24 years |
| Mr. Himanshu Singh | 21-Oct-24 | 10 years |
 Load Structure
Exit Load: Upto 1 year: Redeemed or switched out up to 10% of
the allotment: Nil. • Redeemed or switched out more than 10%
of the allotment: 1% After 1 year: Nil
For detailed load structure please refer Scheme Information
Document of the scheme.
Minimum Application Amount:
₹ 5,000 and in multiples of ₹ 1
thereafter.
Minimum Additional Application Amount:₹ 1,000 and in
multiples of ₹ 1 thereafter.
| Monthly AAUM## As on January 31, 2025 | : ₹ 1,380.56 Crores |
| AUM## As on January 31, 2025 | : ₹ 1,352.64 Crores |
## excluding inter-scheme Investments, if any, by other schemes of Baroda BNP Paribas Mutual Fund, as may be applicable
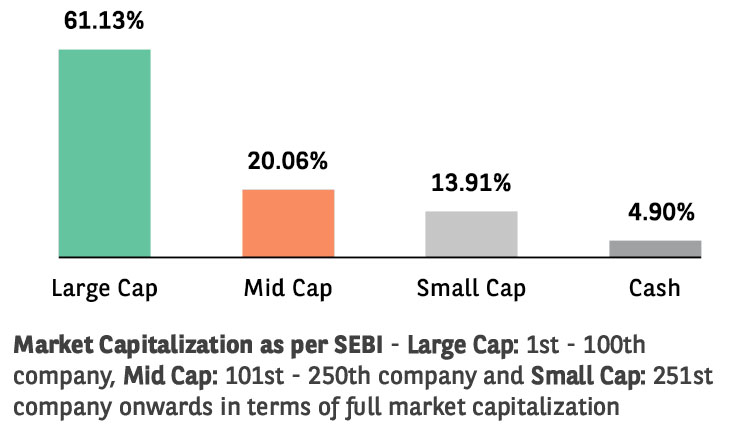
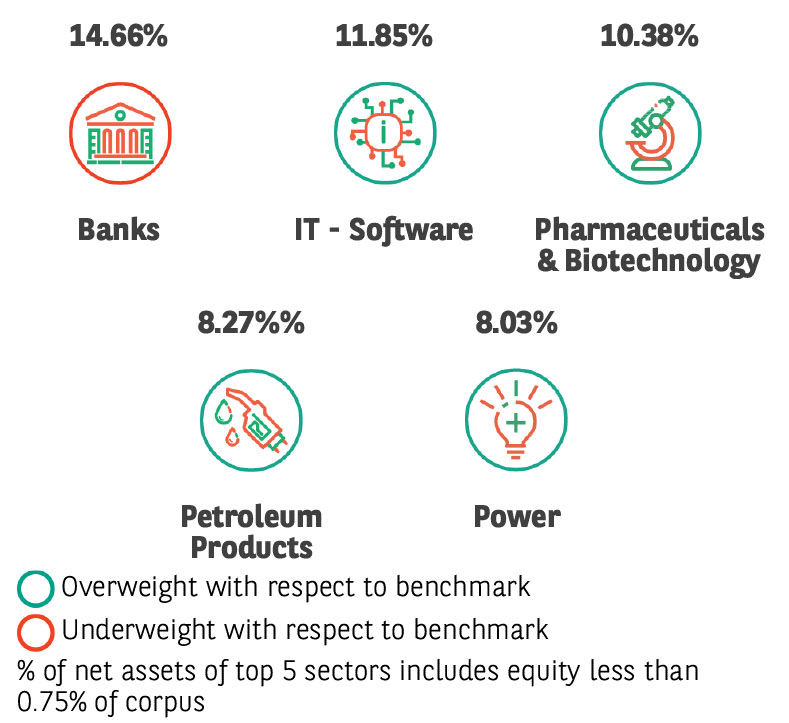
| EQUITY HOLDINGS | % of Net Assets | |
| Banks | 14.08% | |
| ✔ICICI Bank Limited | 6.11% | |
| ✔HDFC Bank Limited | 5.65% | |
| ✔Kotak Mahindra Bank Limited | 2.32% | |
| IT - Software | 11.85% | |
| ✔Infosys Limited | 6.60% | |
| ✔Tata Consultancy Services Limited | 4.10% | |
| Wipro Limited | 1.15% | |
| Pharmaceuticals & Biotechnology | 9.54% | |
| Alkem Laboratories Limited | 2.25% | |
| Divi's Laboratories Limited | 2.06% | |
| Lupin Limited | 1.69% | |
| Sun Pharmaceutical IndustriesLimited | 1.55% | |
| Cipla Limited | 1.09% | |
| Sanofi India Limited | 0.90% | |
| Petroleum Products | 8.27% | |
| ✔Reliance Industries Limited | 4.68% | |
| Bharat Petroleum CorporationLimited | 1.74% | |
| Hindustan Petroleum CorporationLimited | 1.06% | |
| Mangalore Refinery andPetrochemicals Limited | 0.79% | |
| Power | 8.03% | |
| ✔NTPC Limited | 4.07% | |
| Power Grid Corporation of IndiaLimited | 2.01% | |
| SJVN Limited | 1.95% | |
| Finance | 5.93% | |
| Power Finance CorporationLimited | 1.98% | |
| Mas Financial Services Limited | 1.59% | |
| India Shelter Finance CorporationLimited | 1.47% | |
| Jio Financial Services Limited | 0.89% | |
| Gas | 5.14% | |
| ✔Mahanagar Gas Limited | 2.86% | |
| Petronet LNG Limited | 1.17% | |
| Gujarat State Petronet Limited | 1.11% | |
| Electrical Equipment | 3.59% | |
| Bharat Heavy Electricals Limited | 1.85% | |
| GE Vernova T&D India Limited | 1.74% | |
| Auto Components | 3.38% | |
| Jtekt India Limited | 1.33% | |
| Exide Industries Limited | 1.11% | |
| Sundaram Clayton Limited | 0.94% | |
| Consumer Durables | 3.32% | |
| Blue Star Limited | 1.92% | |
| Crompton Greaves ConsumerElectricals Limited | 1.40% | |
| Construction | 3.10% | |
| ✔Larsen & Toubro Limited | 3.10% | |
| Consumable Fuels | 2.78% | |
| ✔Coal India Limited | 2.78% | |
| Insurance | 2.77% | |
| ICICI Prudential Life InsuranceCompany Limited | 1.59% | |
| HDFC Life Insurance CompanyLimited | 1.18% | |
| Aerospace & Defense | 1.84% | |
| Bharat Electronics Limited | 1.84% | |
| Diversified FMCG | 1.65% | |
| ITC Limited | 1.65% | |
| Telecom - Services | 1.59% | |
| Indus Towers Limited | 1.59% | |
| Oil | 1.55% | |
| Oil India Limited | 1.55% | |
| Non - Ferrous Metals | 1.50% | |
| National Aluminium CompanyLimited | 1.50% | |
| Cement & Cement Products | 1.10% | |
| UltraTech Cement Limited | 1.10% | |
| Agricultural Food & other Products | 1.06% | |
| Adani Wilmar Limited | 1.06% | |
| Automobiles | 1.06% | |
| Tata Motors Limited | 1.06% | |
| LESS THAN 0.75% EXPOSURE | 2.05% | |
| TOTAL EQUITY HOLDING | 95.18% | |
| FIXED INCOME HOLDINGS | Rating | % of Net Assets |
| TREASURY BILL | 2.10% | |
| 364 Days Tbill (MD 10/07/2025) | SOV | 0.72% |
| 364 Days Tbill (MD 06/02/2025) | SOV | 0.66% |
| 364 Days Tbill (MD 04/09/2025) | SOV | 0.36% |
| 364 Days Tbill (MD 23/05/2025) | SOV | 0.36% |
| Total Fixed Income Holdings | 2.10% | |
| TREPS, Cash & Other Net Current Assets | 2.72% | |
| GRAND TOTAL | 100.00% |
Investment in Top 10 scrips constitutes 42.27% of the portfolio
| TER - Regular Plan (%) | 2.19% |
| TER - Direct Plan (%) | 1.32% |
| Portfolio Turnover Ratio | 0.66 |
*The information contained in this report has been obtained from sources considered to be authentic and reliable. This quantitative data does not purport to be an offer for purchase and sale of mutual fund units.
| No of Stocks | 53 |
| Portfolio RoE (%) | 19.14 |
| EPS Growth (%) | 25.34 |
Portfolio RoE and EPS Growth is for trailing 12 months (TTM) whereas the number of stocks is as of January 31, 2025.
➤ Capital appreciation over long term.
➤ Investment predominantly in a portfolio of equity and equity related securities by following a value investment strategy
*Investors should consult their financial advisers if in doubt about whether the product is suitable for them.
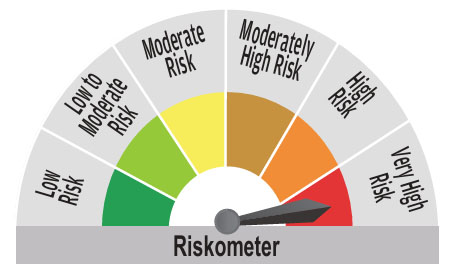
^^Riskometer For Scheme: basis it’s portfolio, ^Riskometer For Benchmark (Nifty 500 TRI): basis it’s constituents; As on January 31, 2025
Mutual Fund investments are subject to market risks, read all scheme related documents carefully.