(An open-ended equity scheme following
the Business Cycles theme)
(An open-ended equity scheme following
the Business Cycles theme)

The investment objective of the Scheme is to generate long term capital appreciation for investors by investing predominantly in equity and equity related securities with a focus on riding business cycles through dynamic allocation between various sectors and stocks at different stages of business cycles in the economy. However, there is no assurance that the investment objective of the Scheme will be achieved.
 NAV Details (As on March 28, 2025)
| Regular Plan - IDCW Option | : ₹ 13.2546 |
| Regular Plan - Growth Option | : ₹ 14.5241 |
| Direct Plan - IDCW Option | : ₹ 13.9526 |
| Direct Plan - Growth Option | : ₹ 15.2924 |
 Benchmark Index (Tier 1)
BSE 500 TRI
 Date of Allotment
September 15, 2021
 Fund Manager
 | Fund Manager | Managing fund since | Experience |
| Mr. Jitendra Sriram | 01-Nov-23 | 27 years |
| Mr. Kushant Arora | 21-Oct-24 | 11 years |
 Load Structure
Exit Load: • Redemption / switch out of units upto 10% ofthe units allotted before 1 year from the date of allotment- NIL • If units are redeemed over and above the 10% limit,before 1 year from the date of allotment - 1% of theapplicable Net Asset Value (NAV) • For redemption / switchout of units after 1 year from the date of allotment NIL
For detailed load structure please refer Scheme
Information Document.
Minimum Amount: Lumpsum investment:
₹ 5,000 and in multiples of ₹ 1
thereafter.
Minimum Additional Application Amount:₹ 1,000 and in
multiples of ₹ 1 thereafter.
| Monthly AAUM## As on March 28, 2025 | : ₹ 531.71 Crores |
| AUM## As on March 28, 2025 | : ₹ 548.80 Crores |
## including inter-scheme Investments, if any, by other schemes of Baroda BNP Paribas Mutual Fund, as may be applicable
| EQUITY HOLDINGS | % of Net Assets | |
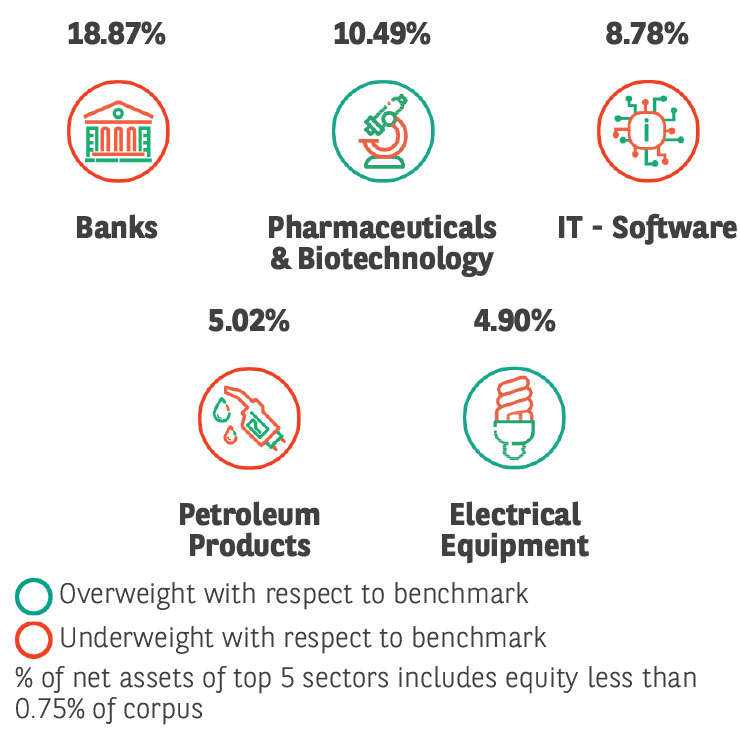
| Banks | 18.15% | |
| ✔HDFC Bank Limited | 6.90% | |
| ✔ICICI Bank Limited | 5.97% | |
| ✔Kotak Mahindra Bank Limited | 4.27% | |
| State Bank of India | 1.01% | |
| Pharmaceuticals & Biotechnology | 9.43% | |
| ✔Sun Pharmaceutical IndustriesLimited | 2.84% | |
| ✔Divi's Laboratories Limited | 2.37% | |
| Torrent Pharmaceuticals Limited | 1.32% | |
| Concord Biotech Limited | 1.10% | |
| Cipla Limited | 0.95% | |
| Natco Pharma Limited | 0.85% | |
| IT - Software | 8.78% | |
| ✔Tata Consultancy Services Limited | 2.96% | |
| Persistent Systems Limited | 2.08% | |
| Infosys Limited | 1.80% | |
| Oracle Financial Services SoftwareLimited | 1.08% | |
| Hexaware Technologies Limited | 0.86% | |
| Petroleum Products | 5.02% | |
| ✔Reliance Industries Limited | 5.02% | |
| Automobiles | 4.73% | |
| TVS Motor Company Limited | 1.51% | |
| Maruti Suzuki India Limited | 1.13% | |
| Tata Motors Limited | 1.11% | |
| Hyundai Motor India Ltd | 0.98% | |
| Electrical Equipment | 4.21% | |
| ✔Hitachi Energy India Limited | 3.11% | |
| Bharat Heavy Electricals Limited | 1.10% | |
| Construction | 4.01% | |
| ✔Larsen & Toubro Limited | 4.01% | |
| Auto Components | 3.86% | |
| ZF Commercial Vehicle ControlSystems India Limited | 1.49% | |
| Bosch Limited | 1.47% | |
| Jtekt India Limited | 0.90% | |
| Retailing | 3.51% | |
| ✔Trent Limited | 2.62% | |
| Zomato Limited | 0.89% | |
| Beverages | 2.92% | |
| Varun Beverages Limited | 1.77% | |
| United Spirits Limited | 1.15% | |
| Power | 2.42% | |
| NTPC Limited | 1.47% | |
| Power Grid Corporation of IndiaLimited | 0.95% | |
| Diversified FMCG | 2.41% | |
| ITC Limited | 1.48% | |
| Hindustan Unilever Limited | 0.93% | |
| Industrial Manufacturing | 1.85% | |
| Tega Industries Limited | 0.97% | |
| Honeywell Automation India Limited | 0.88% | |
| Telecom - Services | 1.71% | |
| Bharti Airtel Limited | 1.71% | |
| Food Products | 1.66% | |
| Nestle India Limited | 1.66% | |
| Cement & Cement Products | 1.60% | |
| UltraTech Cement Limited | 1.60% | |
| Realty | 1.40% | |
| The Phoenix Mills Limited | 1.40% | |
| Chemicals & Petrochemicals | 1.33% | |
| Linde India Limited | 1.33% | |
| Financial Technology (Fintech) | 1.28% | |
| PB Fintech Limited | 1.28% | |
| Aerospace & Defense | 1.24% | |
| Bharat Electronics Limited | 1.24% | |
| IT - Services | 1.23% | |
| Protean eGov Technologies Limited | 1.23% | |
| Healthcare Services | 1.03% | |
| Fortis Healthcare Limited | 1.03% | |
| Agricultural Food & other Products | 1.02% | |
| Adani Wilmar Limited | 1.02% | |
| Industrial Products | 1.00% | |
| Ingersoll Rand (India) Limited | 1.00% | |
| Finance | 0.99% | |
| Bajaj Finserv Limited | 0.99% | |
| Entertainment | 0.96% | |
| Sun TV Network Limited | 0.96% | |
| Insurance | 0.83% | |
| ICICI Prudential Life Insurance Company Limited | 0.83% | |
| LESS THAN 0.75% EXPOSURE | 5.66% | |
| FUTURES LONG POSITION | 0.17% | |
| TOTAL EQUITY HOLDING | 94.41% | |
| FIXED INCOME HOLDINGS | Rating | % of Net Assets |
| TREASURY BILL | 1.05% | |
| 364 Days Tbill (MD 18/12/2025) | SOV | 1.05% |
| Total Fixed Income Holdings | 1.05% | |
| TREPS, Cash & Other Net Current Assets | 4.54% | |
| GRAND TOTAL | 100.00% |
Investment in Top 10 scrips constitutes 40.07% of the portfolio
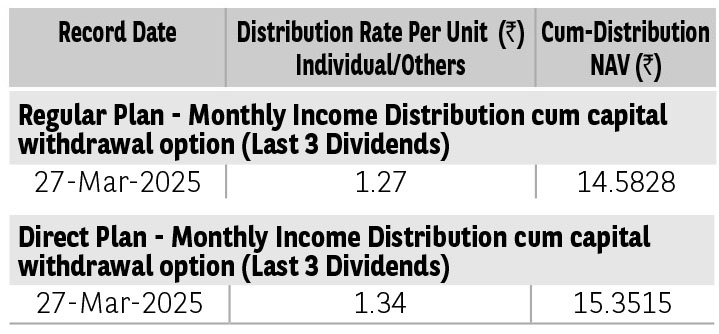
Pursuant to distribution under Income Distribution cum Capital Withdrawal (‘IDCW’) option, NAV of the IDCW option of the scheme(s) would fall to the extent of payout and statutory levy (if applicable). The
amounts under IDCW options can be distributed out of investors capital (Equalization Reserve), which is part of sale price that represents realized gains. Past performance may or may not be sustained in future.
The above stated distribution rate per unit is net distribution rate after deducting applicable taxes. The above distribution rates are on face value of ₹ 10 per unit.
| TER - Regular Plan (%) | 2.36% |
| TER - Direct Plan (%) | 0.82% |
| Portfolio Turnover Ratio | 0.62 |
| PStandard Deviation*†† | 15.78% |
| Beta*†† | 1.03 |
| Sharpe Ratio*†† | 0.44 |
* The information contained in this report has been obtained from sources considered to be authentic and reliable. This quantitative data does not purport to be an offer for purchase and sale of mutual fund units.
The risk free rate of return considered for calculation ofSharpe ratio is 6.40%, as per 1 day MIBOR rate on the lastbusiness day of the month.
Sharpe Ratio (annualised), Standard Deviation (annualised)
and Beta are based on last 36 monthly data points.
| No of Stocks | 61 |
| Portfolio RoE (%) | 18.13 |
| EPS Growth (%) | 36.46 |
➤ Long term wealth creation.
➤ Investment predominantly in equity & equity related securities, including equity derivatives in Indian markets with focus on riding business cycles through dynamic allocation between various sectors & stocks at different stages of business cycles in the economy.
*Investors should consult their financial advisers if in doubt about whether the product is suitable for them.
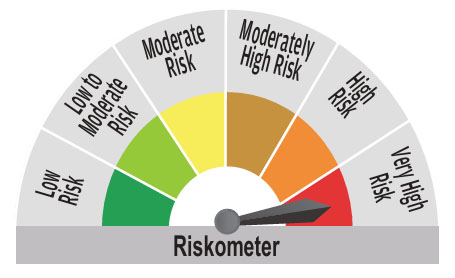
^^Riskometer For Scheme: basis it’s portfolio, ^Riskometer For Benchmark (BSE 500 TRI): basis it’s constituents; As on March 28, 2025
For complete portfolio, kindly refer the website https://www.barodabnpparibasmf.in/
Mutual Fund investments are subject to market risks, read all scheme related documents carefully.