(An open ended scheme investing in equity,
arbitrage and debt instruments)
(An open ended scheme investing in equity,
arbitrage and debt instruments)

The primary objective of the Scheme is to generate capital appreciation and income by using arbitrage opportunities, investment in equity / equity related instruments and debt/ money market instruments. However, there is no assurance that the investment objective of the Scheme will be achieved.
 NAV Details ( As on March 28, 2025)
| Regular Plan - IDCW Option | : ₹ 12.7202 |
| Regular Plan - Growth Option | : ₹ 15.8163 |
| Direct Plan - IDCW Option | : ₹ 13.5243 |
| Direct Plan - Growth Option | : ₹ 16.8199 |
 Benchmark Index (Tier 1)
Nifty Equity Savings Index TRI
 Date of Allotment
July 25, 2019
 Fund Manager
 | Category | Fund Manager | Managing fund since | Experience |
| Equity | Mr. Pratish Krishnan | 05-Sep-19 | 23 years |
| Equity | Mr. Neeraj Saxena | 21-Oct-24 | 20 years |
| Equity | Mr. Ankeet Pandya | 01-Jan-25 | 11 years |
| Fixed Income | Mr. Gurvinder Singh Wasan | 21-Oct-24 | 21 years |
 Load Structure
Exit Load: • if units of the Scheme are redeemed orswitched out within 30 days of the date of allotment - 1%of the applicable Net Asset Value (NAV) • if units of theScheme are redeemed are switched out after 30 days ofallotment Nil
For detailed load structure please refer Scheme
Information Document.
Minimum Amount: Lumpsum investment:
₹ 5,000 and in multiples of ₹ 1 thereafter.
Minimum Additional Application Amount:₹ 1,000 and in multiples of ₹ 1 thereafter
| Monthly AAUM## As on March 28, 2025 | : ₹ 248.12 Crores |
| AUM## As on March 28, 2025 | : ₹ 248.90 Crores |
## including inter-scheme Investments, if any, by other schemes of BNP Paribas Mutual Fund, as may be applicable
| EQUITY HOLDINGS | % of Net Assets | Derivatives |
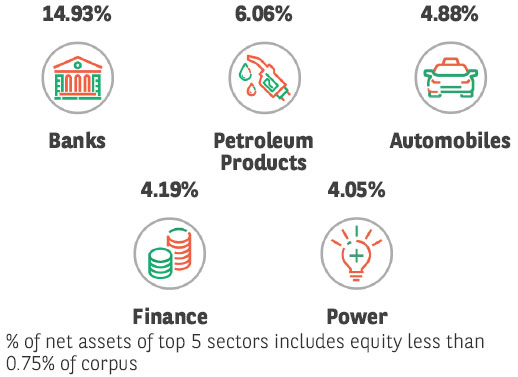
| Banks | 12.50% | -4.78% |
| ✔ HDFC Bank Limited | 5.85% | -2.60% |
| ✔ ICICI Bank Limited | 3.38% | -1.03% |
| ✔ Kotak Mahindra Bank Limited | 2.40% | -1.15% |
| State Bank of India | 0.87% | |
| Petroleum Products | 5.31% | -2.99% |
| ✔ Reliance Industries Limited | 5.31% | -2.99% |
| Automobiles | 4.88% | -2.72% |
| ✔ Maruti Suzuki India Limited | 2.13% | -1.21% |
| Mahindra & Mahindra Limited | 1.98% | -1.51% |
| TVS Motor Company Limited | 0.77% | |
| Power | 4.05% | -3.17% |
| ✔ Tata Power Company Limited | 3.16% | -3.17% |
| NTPC Limited | 0.89% | |
| Cement & Cement Products | 3.11% | -1.95% |
| Ambuja Cements Limited | 1.95% | -1.95% |
| UltraTech Cement Limited | 1.16% | |
| Finance | 2.84% | -0.86% |
| Bajaj Finance Limited | 2.02% | -0.86% |
| Cholamandalam Investment and Finance Company Ltd | 0.82% | |
| Pharmaceuticals & Biotechnology | 2.66% | |
| Divi's Laboratories Limited | 0.97% | |
| Sun Pharmaceutical Industries Limited | 0.87% | |
| Ajanta Pharma Limited | 0.82% | |
| Ferrous Metals | 1.91% | -1.92% |
| Tata Steel Limited | 1.91% | -1.92% |
| Chemicals & Petrochemicals | 1.84% | |
| Linde India Limited | 0.98% | |
| Navin Fluorine International Limited | 0.86% | |
| IT - Software | 1.83% | -0.99% |
| Infosys Limited | 1.83% | -0.99% |
| Realty | 1.78% | -1.79% |
| DLF Limited | 1.78% | -1.79% |
| Transport Infrastructure | 1.44% | -1.45% |
| Adani Ports and Special Economic Zone Limited | 1.44% | -1.45% |
| Telecom - Services | 1.16% | |
| Bharti Airtel Limited | 1.16% | |
| Construction | 1.04% | |
| Larsen & Toubro Limited | 1.04% | |
| Insurance | 0.92% | |
| Max Financial Services Limited | 0.92% | |
| Retailing | 0.88% | |
| Trent Limited | 0.88% | |
| Electrical Equipment | 0.79% | |
| Hitachi Energy India Limited | 0.79% | |
| Financial Technology (Fintech) | 0.77% | |
| PB Fintech Limited | 0.77% | |
| Non - Ferrous Metals | 0.77% | |
| Hindalco Industries Limited | 0.77% | |
| LESS THAN 0.75% EXPOSURE | 16.70% | -2.47% |
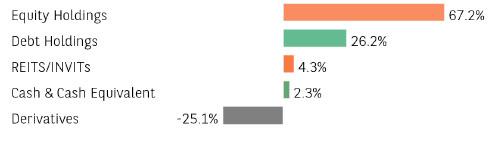
| TOTAL EQUITY HOLDING | 67.18% | -25.09% |
| REITs/InvITs Holdings | % of Net Assets | |
| Brookfield India Real Estate Trust | 3.28% | |
| IndiGrid Infrastructure Trust | 1.06% | |
| Total REITs/InvITs Holdings | 4.34% | |
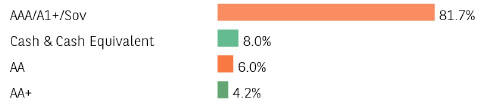
| FIXED INCOME HOLDINGS | Rating | % of Net Assets |
| GOVERNMENT BOND | 13.92% | |
| ✔ 7.32% GOI (MD 13/11/2030) | Sovereign | 7.09% |
| ✔ 6.79% GOI (MD 07/10/2034) | Sovereign | 2.85% |
| 5.15% GOI (MD 09/11/2025) | Sovereign | 1.99% |
| 5.63% GOI (MD 12/04/2026) | Sovereign | 1.99% |
| CORPORATE BOND | 12.27% | |
| ✔ Power Finance Corporation Limited | CRISIL AAA | 4.04% |
| ✔ Indian Railway Finance Corporation Limited | CRISIL AAA | 2.03% |
| REC Limited | CRISIL AAA | 2.02% |
| Export Import Bank of India | CRISIL AAA | 1.26% |
| 360 One Prime Limited | CRISIL AA | 1.21% |
| Muthoot Finance Limited | CRISIL AA+ | 1.21% |
| Piramal Capital & Housing Finance Limited | ICRA AA | 0.50% |
| Total Fixed Income Holdings | 26.19% | |
| TREPS, Cash & Other Net Current Assets | 2.29% | |
| GRAND TOTAL | 100.00% |
Investment in Top 10 scrips constitutes
38.24%
of the portfolio
Net equity holdings is
42.09%
of the portfolio
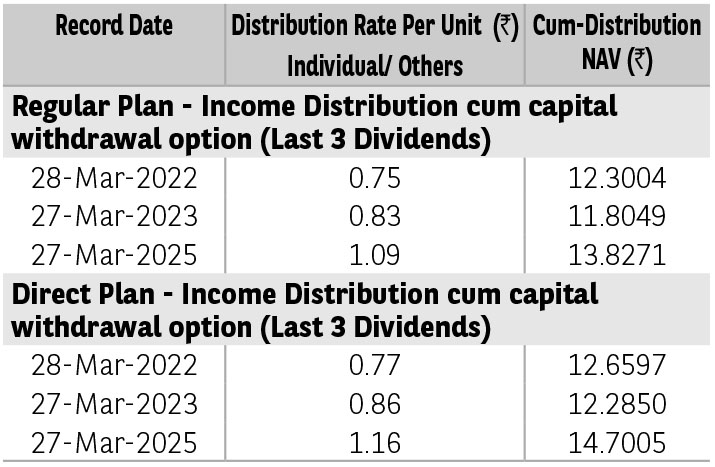
Pursuant to distribution under Income Distribution cum Capital Withdrawal (‘IDCW’) option, NAV of the IDCW option of the scheme(s) would fall to the extent of payout and statutory levy (if applicable). The
amounts under IDCW options can be distributed out of investors capital (Equalization Reserve), which is part of sale price that represents realized gains. Past performance may or may not be sustained in future.
The above stated distribution rate per unit is net distribution rate after deducting applicable taxes. The above distribution rates are on face value of ₹ 10 per unit.
| TER - Regular Plan (%) | 2.48% |
| TER - Direct Plan (%) | 1.31% |
| Portfolio Turnover Ratio | 4.70 |
| Standard Deviation* | 5.52% |
| Beta* | 1.07 |
| Sharpe Ratio* | 0.28 |
| Sharpe Ratio (annualised), Standard Deviation (annualised) and Beta are based on last 36 monthly data points. | |
*The information contained in this report has been obtained from sources considered to be authentic and reliable. This quantitative data does not purport to be an offer for purchase and sale of mutual fund units.
The risk free rate of return considered for calculation of Sharpe ratio is 6.76%, as per 1 day MIBOR rate on the last business day of the month.
| Average Maturity (years) | 4.21 |
| Modified Duration (years) | 3.24 |
| YTM (%) | 6.97% |
| Macaulay Duration† (years) | 3.40 |
†Concept of Macaulay duration: The Macaulay Duration is a measure of a bond’s sensitivity to interest rate changes. It is expressed in annual terms. It is the weighted average term to maturity of the cash flows from a bond. The weight of each cash flow is determined by dividing the present value of the cash flow by the price. Factors like a bond’s price, maturity, coupon, yield to maturity among others impact the calculation of Macaulay duration. The Macaulay duration can be viewed as the economic balance point of a group of cash flows. Another way to interpret the statistic is that it is the weighted average number of years an investor must maintain a position in the bond until the present value of the bond’s cash flows equals the amount paid for the bond. As it provides a way to estimate the effect of certain market changes on a bond’s price, the investor can choose an investment that will better meet his future cash needs.
➤ Long term capital appreciation and income generation.
➤ Investment in equity and equity related securities, arbitrage opportunities, and debt and money market instruments.
*Investors should consult their financial advisers if in doubt about whether the product is suitable for them.
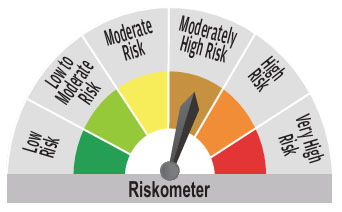
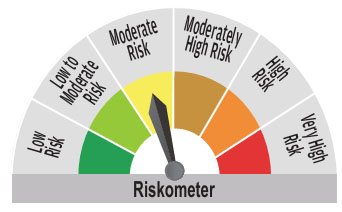
^^Riskometer For Scheme: basis it’s portfolio, ^Riskometer For Benchmark (Nifty Equity Savings Index TRI): basis it’s constituents; As on March 28, 2025
For complete portfolio, kindly refer the website https://www.barodabnpparibasmf.in/
Mutual Fund investments are subject to market risks, read all scheme related documents carefully.