Financial Services Fund
(An open ended equity scheme investing in the
Banking and Financial Services sector)
Financial Services Fund
(An open ended equity scheme investing in the
Banking and Financial Services sector)

The investment objective is to generate long term capital appreciation for unit holders from a portfolio invested predominantly in equity and equity related securities of companies engaged in the Banking & Financial Services Sector. However, there can be no assurance that the investment objectives of the Scheme will be realized. The Scheme does not guarantee/indicate any returns.
 NAV Details (As on November 29, 2024)
| Regular Plan - Growth Option | : ₹ 44.2154 |
| Regular Plan - IDCW Option | : ₹ 21.7587 |
| Direct Plan - Growth Option | : ₹48.9974 |
| Direct Plan - IDCW Option | : ₹24.6348 |
 Benchmark Index (Tier 1)
Nifty Financial Services TRI
 Date of Allotment
June 22, 2012
 Fund Manager
 | Fund Manager | Managing fund since | Experience |
| Sandeep Jain | 14-Mar-22 | 17 years |
| Mr. Arjun Bagga^ | 21-Oct-24 | 7 years |
^ Mr. Arjun Bagga was appointed as Co Fund Manager from October 21, 2024.
 Load Structure
Entry Load: Not Applicable
Exit Load: • If units of the Scheme are redeemed or switched out within 30 days of the date of allotment - 1% of the applicable
Net Asset Value (NAV) • If units of the Scheme are redeemed or
switched out after 30 days of allotment - Nil
For detailed load structure please refer Scheme Information
Document of the scheme.
Minimum Application Amount:
₹ 5,000 and in multiples of ₹ 1
thereafter.
Minimum Additional Application Amount:₹ 1,000 and in
multiples of ₹ 1 thereafter.
| Monthly AAUM## As on November 30, 2024 | : ₹ 195.17 Crores |
| AUM## As on November 30, 2024 | : ₹ 204.47 Crores |
## excluding inter-scheme Investments, if any, by other schemes of Baroda BNP Paribas Mutual Fund, as may be applicable
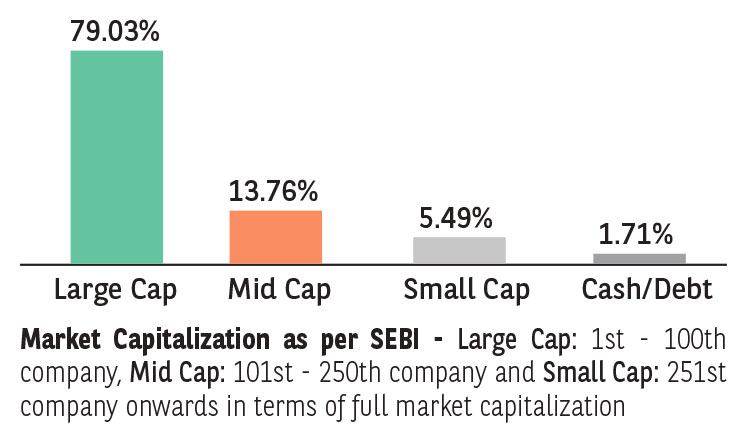
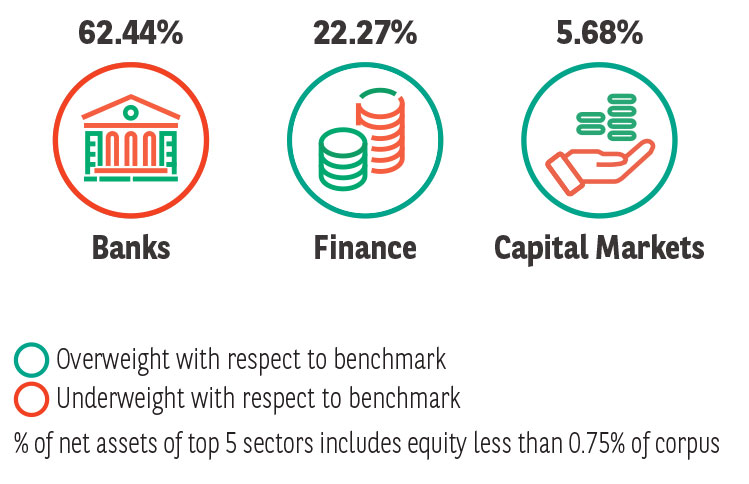
| EQUITY HOLDINGS | % of Net Assets | |
| BANKS | 62.44% | |
| AU Small Finance Bank Limited | 1.93% | |
| ✔ Axis Bank Limited | 5.56% | |
| City Union Bank Limited | 1.10% | |
| ✔ HDFC Bank Limited | 22.00% | |
| ✔ ICICI Bank Limited | 18.12% | |
| IndusInd Bank Limited | 0.75% | |
| ✔ Kotak Mahindra Bank Limited | 4.44% | |
| Punjab National Bank | 1.50% | |
| ✔ State Bank of India | 7.04% | |
| CAPITAL MARKETS | 5.68% | |
| 360 One WAM Limited | 1.31% | |
| Angel One Limited | 1.28% | |
| Computer Age Management Services Limited | 1.45% | |
| HDFC Asset Management Company Limited | 1.64% | |
| FINANCE | 21.91% | |
| ✔ Bajaj Finance Limited | 2.40% | |
| ✔ Bajaj Finserv Limited | 2.90% | |
| ✔ Bajaj Housing Finance Limited | 2.49% | |
| Cholamandalam Investment and Finance Company Ltd | 1.21% | |
| CRISIL Limited | 2.23% | |
| Jio Financial Services Limited | 0.80% | |
| Muthoot Finance Limited | 1.88% | |
| Poonawalla Fincorp Limited | 1.21% | |
| ✔ Power Finance Corporation Limited | 2.42% | |
| REC Limited | 2.01% | |
| ✔ Shriram Finance Limited | 2.36% | |
| FINANCIAL TECHNOLOGY (FINTECH) | 3.37% | |
| One 97 Communications Limited | 1.10% | |
| PB Fintech Limited | 2.27% | |
| INSURANCE | 2.79% | |
| HDFC Life Insurance Company Limited | 1.29% | |
| ICICI Lombard General Insurance Company Limited | 1.50% | |
| FUTURES LONG POSITION | 1.74% | |
| HDFC Bank Limited | 1.16% | |
| ICICI Bank Limited | 0.58% | |
| LESS THAN 0.75% EXPOSURE | 0.36% | |
| Total Equity Holdings | 98.29% | |
| TREASURY BILL | 0.34% | |
| 182 Days Tbill (MD 14/02/2025) | Sovereign | 0.36% |
| Total Fixed Income Holdings | 0.34% | |
| TREPS, Cash & Other Net Current Assets | 1.37% | |
| GRAND TOTAL | 100.00% |
Investment in Top 10 scrips constitutes 69.73% of the portfolio
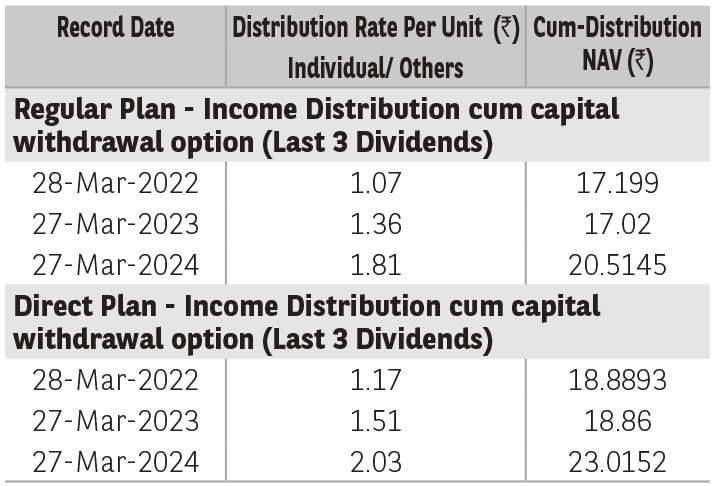
Pursuant to distribution under Income Distribution cum Capital Withdrawal (‘IDCW’) option, NAV of the IDCW option of the scheme(s) would fall to the extent of payout and statutory levy (if applicable). The
amounts under IDCW options can be distributed out of investors capital (Equalization Reserve), which is part of sale price that represents realized gains. Past performance may or may not be sustained in future.
The above stated distribution rate per unit is net distribution rate after deducting applicable taxes. The above distribution rates are on face value of ₹ 10 per unit.
| TER - Regular Plan (%) | 2.43% |
| TER - Direct Plan (%) | 0.98% |
| Portfolio Turnover Ratio | 1.14 |
| Standard Deviation* | 14.29% |
| Beta* | 0.94 |
| Sharpe Ratio* | 0.68 |
| Sharpe Ratio (annualised), Standard Deviation (annualised) and Beta are based on last 36 monthly data points. | |
* The information contained in this report has been obtained from sources considered to be authentic and reliable. This quantitative data does not purport to be an offer for purchase and sale of mutual fund units. The risk free rate of return considered for calculation of Sharpe ratio is 6.67%, as per 1 day MIBOR rate on the last business day of the month.
| No of Stocks | 31 |
| Portfolio RoE (%) | 16.85 |
| EPS Growth (%) | 26.93 |
Portfolio RoE and EPS Growth is for trailing 12 months (TTM) whereas the number of stocks is as of November 30, 2024.
➤ Capital appreciation over long term.
➤ Investment predominantly in equity and equity related securities of companies engaged in the Banking & Financial Services Sector.
*Investors should consult their financial advisers if in doubt about whether the product is suitable for them.
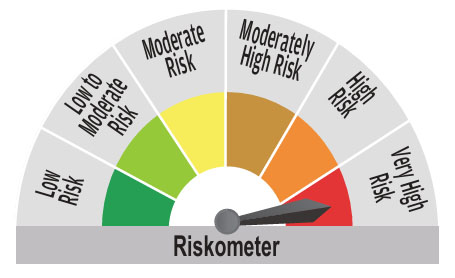
^^Riskometer For Scheme: basis it’s portfolio, ^Riskometer For Benchmark (Nifty Financial Services TRI): basis it’s constituents; As on November 30, 2024
Mutual Fund investments are subject to market risks, read all scheme related documents carefully.