(An open-ended liquid scheme. A Relatively Low
Interest Rate Risk and Moderate Credit Risk Scheme)
(An open-ended liquid scheme.
A Relatively Low Interest Rate Risk
and Moderate Credit Risk
Scheme)


The primary objective of the Scheme is to generate income with a high level of liquidity by investing in a portfolio of money market and debt securities. There is no assurance that the investment objective of the Scheme will be realized.
 NAV Details (As on November 29, 2024)
| Regular Plan - Growth Option | : ₹ 2885.3750 |
| Regular Plan - Daily IDCW Option | : ₹ 1001.1996 |
| Regular Plan - Weekly IDCW Option | : ₹ 1000.8077 |
| Direct Plan - Growth Option | : ₹ 2919.5917 |
| Direct Plan - Daily IDCW Option | : ₹ 1002.0849 |
| Direct Plan - Weekly IDCW Option | : ₹ 1219.3858 |
 Benchmark Index (Tier 1)
 Date of Allotment
February 21, 2002
 Fund Manager
| Fund Manager | Managing fund since | Experience |
| Vikram Pamnani | 14-Mar-22 | 14 years |
| Gurvinder Singh Wasan^ | 21-Oct-24 | 21 years |
^ Mr. Gurvinder Singh Wasan was appointed as Co Fund Manager w.e.f October 21, 2024 in place of Mr. Prashant Pimple.
 Load Structure
Entry Load :
| Exit Load^ | |
| Investor exit upon subscribtion | exit load as % of redmeption proceeds |
| Day 1 | 0.0070% |
| Day 2 | 0.0065% |
| Day 3 | 0.0060% |
| Day 4 | 0.0055% |
| Day 5 | 0.0050% |
| Day 6 | 0.0045% |
| Day 7 onwards | 0.0000% |
| For detailed load structure please refer Scheme Information
Document of the scheme. ^Pursuant to para 4.5.4 of SEBI Master Circular No. SEBI/HO/IMD/IMD-PoD-1/P/CIR/2024/90 dated June 27, 2024. | |
Minimum Application Amount:
₹ 5,000 and in multiples of ₹ 1 thereafter.
Minimum Additional Application Amount:
₹ 1,000 and in multiples of ₹ 1 thereafter.
| Monthly AAUM## As on November 30, 2024 | : ₹ 11,515.94 Crores |
| AUM## As on November 30, 2024 | : ₹ 11,193.07 Crores |
## excluding inter-scheme Investments, if any,by other schemes of Baroda BNP Paribas Mutual Fund, as may be applicable.
| Fixed Income Holdings | Rating | % of Net Assets |
| CERTIFICATE OF DEPOSIT | 32.55% | |
| ✔HDFC Bank Limited | CARE A1+ | 4.41% |
| ✔Canara Bank | CRISIL A1+ | 4.23% |
| ✔State Bank of India | CRISIL A1+ | 4.00% |
| ✔Punjab National Bank | FITCH A1+ | 3.97% |
| ICICI Bank Limited | ICRA A1+ | 2.45% |
| Small Industries Dev Bank of India | CRISIL A1+ | 2.42% |
| HDFC Bank Limited | CRISIL A1+ | 2.23% |
| Union Bank of India | ICRA A1+ | 2.20% |
| Punjab National Bank | CRISIL A1+ | 1.33% |
| Union Bank of India | FITCH A1+ | 1.32% |
| Kotak Mahindra Bank Limited | CRISIL A1+ | 1.11% |
| Axis Bank Limited | CRISIL A1+ | 0.89% |
| Small Industries Dev Bank of India | CARE A1+ | 0.89% |
| National Bank For Agriculture and Rural Development | CRISIL A1+ | 0.66% |
| Punjab National Bank | ICRA A1+ | 0.44% |
| COMMERCIAL PAPER | 46.14% | |
| ✔Export Import Bank of India | CRISIL A1+ | 4.15% |
| ✔ICICI Securities Limited | CRISIL A1+ | 3.97% |
| ✔Grasim Industries Limited | CRISIL A1+ | 3.57% |
| ✔Hero Fincorp Limited | CRISIL A1+ | 3.40% |
| Piramal Capital & Housing Finance Limited | CRISIL A1+ | 3.00% |
| Adani Ports and Special Economic Zone Limited | CARE A1+ | 2.67% |
| Reliance Retail Ventures Limited | CRISIL A1+ | 2.64% |
| Reliance Jio Infocomm Limited | CRISIL A1+ | 2.23% |
| PNB Housing Finance Limited | CRISIL A1+ | 2.21% |
| UltraTech Cement Limited | CRISIL A1+ | 2.21% |
| Motilal Oswal Financial Services Limited | ICRA A1+ | 1.78% |
| Larsen & Toubro Limited | CRISIL A1+ | 1.76% |
| Reliance Industries Limited | CRISIL A1+ | 1.76% |
| DMI Finance Private Limited | ICRA A1+ | 1.47% |
| Kisetsu Saison Fin Ind Pvt Ltd | CRISIL A1+ | 1.34% |
| Standard Chartered Capital Limited | CRISIL A1+ | 1.34% |
| TVS Credit Services Limited | CRISIL A1+ | 1.32% |
| 360 One Prime Limited | CRISIL A1+ | 0.89% |
| Adani Ports and Special Economic Zone Limited | CRISIL A1+ | 0.89% |
| SBICAP Securities Limited | CRISIL A1+ | 0.89% |
| Aditya Birla Housing Finance Limited | ICRA A1+ | 0.89% |
| Barclays Investments & Loans (India) Private Limited | CRISIL A1+ | 0.66% |
| Deutsche Investments India Pvt Limited | CRISIL A1+ | 0.66% |
| Hinduja Leyland Finance Limited | CRISIL A1+ | 0.44% |
| TREASURY BILL | 15.79% | |
| ✔91 Days Tbill (MD 05/12/2024) | Sovereign | 4.54% |
| ✔91 Days Tbill (MD 13/02/2025) | Sovereign | 3.53% |
| 364 Days Tbill (MD 06/02/2025) | Sovereign | 2.65% |
| 364 Days Tbill (MD 30/01/2025) | Sovereign | 2.17% |
| 182 Days Tbill (MD 19/12/2024) | Sovereign | 1.56% |
| 91 Days Tbill (MD 12/12/2024) | Sovereign | 1.34% |
| CORPORATE DEBT MARKET DEVELOPMENT FUND | 0.18% | |
| Corporate Debt Market Development Fund Class A2 | Others | 0.18% |
| Total Fixed Income Holdings | 94.66% | |
| TREPS, Cash & Other Net Current Assets | 5.34% | |
| GRAND TOTAL | 100.00% |
Investment in Top 10 scrips constitutes 39.77% of the portfolio
The scheme currently does not have Distribution History.
| TER - Regular Plan (%) | 0.31% |
| TER - Direct Plan (%) | 0.17% |
| Average Maturity (days) | 39 |
| Modified Duration (days) | 39 |
| YTM (%) | 7.12% |
| Macaulay Duration† (days) | 39 |
* The information contained in this report has been obtained from sources considered to be authentic and reliable. The quantitative data does not purport
to be an offer for purchase and sale of mutual fund units
†Concept of Macaulay duration: The Macaulay Duration is a
measure of a bond’s sensitivity to interest rate changes. It is
expressed in annual terms. It is the weighted average term to
maturity of the cash flows from a bond. The weight of each
cash flow is determined by dividing the present value of the
cash flow by the price. Factors like a bond’s price, maturity,
coupon, yield to maturity among others impact the calculation
of Macaulay duration. The Macaulay duration can be viewed as
the economic balance point of a group of cash flows. Another
way to interpret the statistic is that it is the weighted average
number of years an investor must maintain a position in the
bond until the present value of the bond’s cash flows equals
the amount paid for the bond. As it provides a way to estimate
the effect of certain market changes on a bond’s price, the
investor can choose an investment that will better meet his
future cash needs.
| Credit Risk (Max) → | Relatively Low Class A (CRV>=12) | Moderate: Class B (CRV>=10) | Relatively High: Class C (CRV<10) |
| Interest Rate Risk (Max) ↓ | |||
| Relatively Low: Class I (MD<=1 year) | B-I | ||
| Moderate: Class II (MD<=3 year) | |||
| Relatively High: Class III (Any MD) |
MD=Macaulay Duration, CRV=Credit Risk Value.
‡ The PRC matrix denotes the maximum risk that the respective Scheme can take i.e. maximum interest rate risk (measured
by MD of the Scheme) and maximum credit risk (measured by CRV of the Scheme)
➤ Regular income over short term with high level of liquidity.
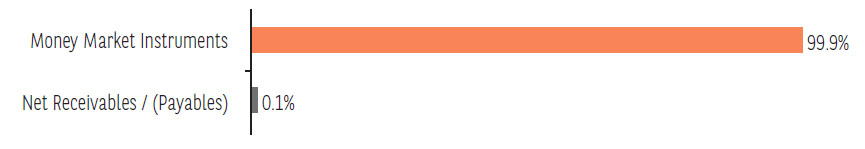
➤ Investment predominantly in money market (i.e. CP/CDs) instruments
*Investors should consult their financial advisers if in doubt about whether the product is suitable for them.
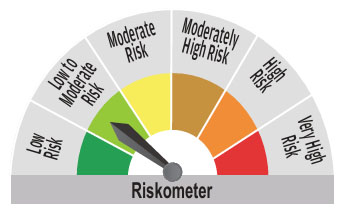
^^Riskometer For Scheme: basis it’s portfolio, ^Riskometer For Benchmark (CRISIL Liquid Debt A-I Index): basis it’s constituents; As on November 30, 2024
** CARE’s fund quality rating is not a recommendation to purchase, sell, or hold a security/ fund. It neither comments on the current market price, suitability
for a particular investor nor on the prospective performance of the fund with respect to appreciation, volatility of net asset value (NAV), or yield of the fund.
The ratings do not address the funds ability to meet the payment obligations to the investors.
†† The rating, as aforesaid, however, should not be treated as a recommendation to buy, sell or hold the units issued by you. The rating is restricted to your
debt fund only. ICRA does not assume any responsibility on its part, for any liability, that may arise consequent to your not complying with any guidelines or
directives issued by SEBI or any other mutual fund regulatory body.
Mutual Fund investments are subject to market risks, read all scheme related documents carefully.