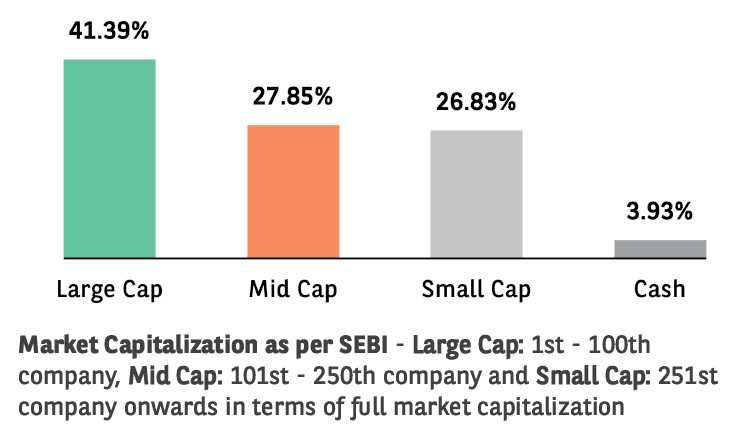
(An open ended equity scheme investing across
large cap, mid-cap and small cap stocks)
(An open ended equity scheme investing across
large cap, mid-cap and small cap stocks)

The investment objective is to generate long term capital appreciation from an actively managed portfolio of equity & equity related instruments. The Scheme does not guarantee/ indicate any returns. However, there is no assurance that the investment objective of the Scheme will be achieved.
 NAV Details (As on February 28, 2025)
| Regular Plan - IDCW Option | : ₹48.6443 |
| Regular Plan - Growth Option | : ₹245.3787 |
| Direct Plan - IDCW Option | : ₹51.4605 |
| Direct Plan - Growth Option | : ₹274.3035 |
 Benchmark Index (Tier 1)
Nifty 500 Multicap 50:25:25 TRI
 Date of Allotment
September 12, 2003
 Fund Manager
 | Fund Manager | Managing fund since | Experience |
| Mr.Sanjay Chawla | 01-Nov-15 | 33 years |
| Mr.Sandeep Jain | 14-Mar-22 | 16 years |
 Load Structure
Exit Load: • 1% if redeemed on or before 12 months from
the date of allotment of units. NIL if redeemed after 12
months from the date of allotment of units
For detailed load structure please refer Scheme
Information Document.
Minimum Amount: Lumpsum investment:
₹ 5,000 and in multiples of ₹ 1 thereafter.
Minimum Additional Application Amount:₹ 1,000 and in multiples of ₹ 1 thereafter.
| Monthly AAUM## As on February 28, 2025 | : ₹ 2,567.38 Crores |
| AUM## As on February 28, 2025 | : ₹ 2,400.75 Crores |
## including inter-scheme Investments, if any, by other schemes of Baroda BNP Paribas Mutual Fund, as may be applicable
| EQUITY HOLDINGS | % of Net Assets | |
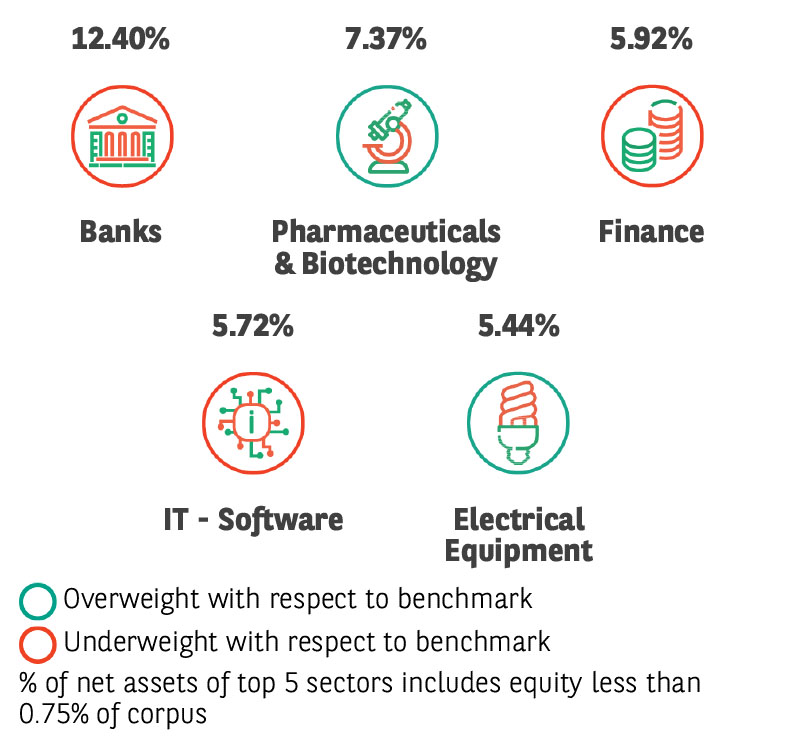
| Banks | 12.40% | |
| ✔ICICI Bank Limited | 4.19% | |
| ✔HDFC Bank Limited | 3.61% | |
| Kotak Mahindra Bank Limited | 1.94% | |
| Karur Vysya Bank Limited | 1.66% | |
| State Bank of India | 1.00% | |
| Pharmaceuticals & Biotechnology | 7.37% | |
| ✔Divi's Laboratories Limited | 2.28% | |
| ✔Sun Pharmaceutical Industries Limited | 2.26% | |
| Concord Biotech Limited | 1.72% | |
| IPCA Laboratories Limited | 1.11% | |
| Finance | 5.92% | |
| PNB Housing Finance Limited | 1.94% | |
| CRISIL Limited | 1.44% | |
| Power Finance Corporation Limited | 1.37% | |
| Cholamandalam Investment and Finance Company Ltd | 1.17% | |
| IT - Software | 5.72% | |
| ✔Infosys Limited | 2.04% | |
| Persistent Systems Limited | 1.66% | |
| Hexaware Technologies Limited | 1.17% | |
| Mastek Limited | 0.85% | |
| Electrical Equipment | 5.44% | |
| Hitachi Energy India Limited | 1.67% | |
| GE Vernova T&D India Limited | 1.39% | |
| Bharat Heavy Electricals Limited | 1.37% | |
| CG Power and Industrial Solutions Limited | 1.01% | |
| Healthcare Services | 4.98% | |
| Max Healthcare Institute Limited | 1.83% | |
| Rainbow Childrens Medicare Limited | 1.80% | |
| Dr. Lal Path Labs Limited | 1.35% | |
| Automobiles | 4.78% | |
| Mahindra & Mahindra Limited | 1.78% | |
| TVS Motor Company Limited | 1.51% | |
| Maruti Suzuki India Limited | 1.49% | |
| Chemicals & Petrochemicals | 4.10% | |
| ✔Navin Fluorine International Limited | 2.19% | |
| Linde India Limited | 1.91% | |
| Consumer Durables | 4.03% | |
| Dixon Technologies (India) Limited | 1.74% | |
| Amber Enterprises India Limited | 1.17% | |
| Blue Star Limited | 1.12% | |
| Petroleum Products | 3.75% | |
| ✔Reliance Industries Limited | 3.75% | |
| Beverages | 3.54% | |
| ✔Radico Khaitan Limited | 2.15% | |
| Varun Beverages Limited | 1.39% | |
| IT - Services | 3.34% | |
| ✔Sagility India Limited | 2.24% | |
| Protean eGov Technologies Limited | 1.10% | |
| Retailing | 3.15% | |
| Zomato Limited | 1.84% | |
| Trent Limited | 1.31% | |
| Industrial Manufacturing | 2.69% | |
| Tega Industries Limited | 1.66% | |
| Jyoti CNC Automation Ltd | 1.03% | |
| Insurance | 2.52% | |
| Max Financial Services Limited | 1.43% | |
| ICICI Lombard General Insurance Company Limited | 1.09% | |
| Food Products | 2.09% | |
| ✔Mrs. Bectors Food Specialities Limited | 2.09% | |
| Telecom - Services | 1.96% | |
| Bharti Airtel Limited | 1.96% | |
| Personal Products | 1.85% | |
| Dabur India Limited | 1.85% | |
| Agricultural Food & other Products | 1.77% | |
| Adani Wilmar Limited | 1.77% | |
| Realty | 1.63% | |
| The Phoenix Mills Limited | 1.63% | |
| Industrial Products | 1.57% | |
| KEI Industries Limited | 1.57% | |
| Construction | 1.57% | |
| Larsen & Toubro Limited | 1.57% | |
| Leisure Services | 1.46% | |
| Jubilant Foodworks Limited | 1.46% | |
| Commercial Services & Supplies | 1.44% | |
| Firstsource Solutions Limited | 1.44% | |
| Textiles & Apparels | 1.27% | |
| Page Industries Limited | 1.27% | |
| Auto Components | 1.22% | |
| Amara Raja Energy & Mobility Ltd | 1.22% | |
| Financial Technology (Fintech) | 1.22% | |
| PB Fintech Limited | 1.22% | |
| Power | 1.04% | |
| Power Grid Corporation of India Limited | 1.04% | |
| Cement & Cement Products | 1.03% | |
| UltraTech Cement Limited | 1.03% | |
| Capital Markets | 0.98% | |
| Computer Age Management Services Limited | 0.98% | |
| LESS THAN 0.75% EXPOSURE | 0.24% | |
| TOTAL EQUITY HOLDING | 96.07% | |
| FIXED INCOME HOLDINGS | Rating | % of Net Assets |
| TREASURY BILL | 0.79% | |
| 364 Days Tbill (MD 18/12/2025) | SOV | 0.79% |
| Total Fixed Income Holdings | 0.79% | |
| TREPS, Cash & Other Net Current Assets | 3.14% | |
| GRAND TOTAL | 100.00% |
Investment in Top 10 scrips constitutes 26.80% of the portfolio
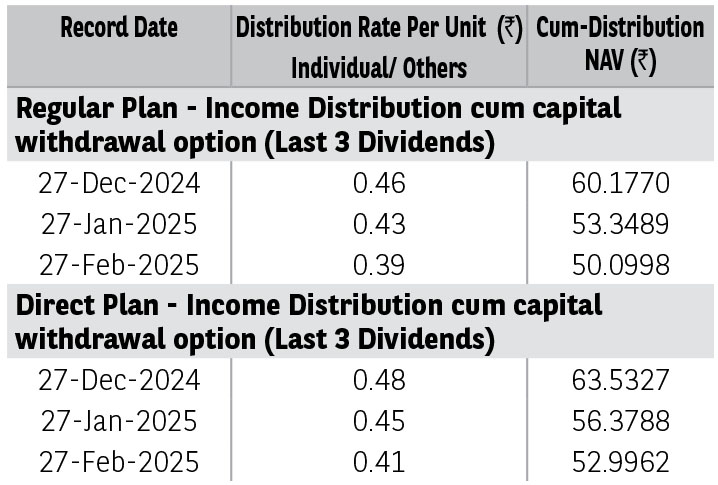
Pursuant to distribution under Income Distribution cum Capital Withdrawal (‘IDCW’) option, NAV of the IDCW option of the scheme(s) would fall to the extent of payout and statutory levy (if applicable). The
amounts under IDCW options can be distributed out of investors capital (Equalization Reserve), which is part of sale price that represents realized gains. Past performance may or may not be sustained in future.
The above stated distribution rate per unit is net distribution rate after deducting applicable taxes. The above distribution rates are on face value of ₹ 10 per unit.
| TER - Regular Plan (%) | 1.99% |
| TER - Direct Plan (%) | 0.95% |
| Portfolio Turnover Ratio | 1.15 |
| Standard Deviation*†† | 15.33% |
| Beta*†† | 0.94 |
| Sharpe Ratio*†† | 0.52 |
| Sharpe Ratio (annualised), Standard Deviation (annualised) and Beta are based on last 36 monthly data points. | |
| †† The scheme is a ‘Transferee Scheme’, and accordingly, the ratios are being provided considering the weighted average NAVs of both the Transferor Scheme and Transferee Scheme. | |
The risk free rate of return considered for calculation ofSharpe ratio is 6.40%, as per 1 day MIBOR rate on the lastbusiness day of the month.
| No of Stocks | 59 |
| Portfolio RoE (%) | 15.90 |
| EPS Growth (%) | 36.40 |
➤ Capital appreciation over long term.
➤ Investments predominantly in equity and equity related instruments.
*Investors should consult their financial advisers if in doubt about whether the product is suitable for them.
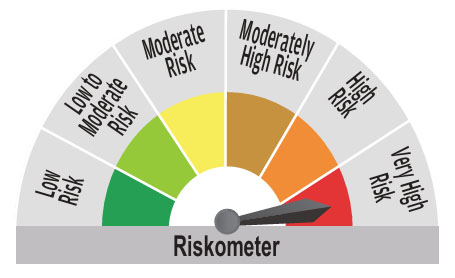
^^Riskometer For Scheme: basis it’s portfolio, ^Riskometer For Benchmark (Nifty 500 Multicap 50:25:25 TRI): basis it’s constituents; As on February 28, 2025
Mutual Fund investments are subject to market risks, read all scheme related documents carefully.
For complete portfolio, kindly refer the website https://www.barodabnpparibasmf.in/