(An open ended balanced advantage fund)
(An open ended balanced advantage fund)

The primary objective of the Scheme is to generate capital appreciation by investing in a portfolio of equity or equity linked securities while the secondary objective is to generate income through investments in debt and Money Market Instruments. It also aims to manage risk through active asset allocation. However, there can be no assurance that the investment objectives of the Scheme will be realized. The Scheme does not guarantee/indicate any returns.
 NAV Details (As On February 28, 2023)
| Regular Plan - Growth Option | : ₹ 16.61 |
| Regular Plan - IDCW Option | : ₹ 14.41 |
| Direct Plan - Growth Option | : ₹ 17.65 |
| Direct Plan - IDCW Option | : ₹ 15.35 |
 Benchmark Index (Tier 1)
NIFTY 50 Hybrid Composite debt 50:50 Index
 Date of Allotment
November 14, 2018
 Fund Manager μ
| Category | Fund Manager | Managing fund since | Experience |
| Equity | Sanjay Chawla | 14-Nov-18 | 33 years |
| Equity | Pratish Krishnan | 05-Aug-21 | 22 years |
| Fixed Income | Prashant Pimple | 21-Oct-22 | 16 years |
 Load Structure
Entry Load
Exit Load: If units are redeemed upto 10% of the units, on or before one year from the date of allotment: Nil; If units are redeemed over and above the 10% limit, on or before one year from the date of allotment: 1% of the applicable Net asset Value (NAV); If the units are redeemed after one year from the date of allotment: Nil
For detailed load structure please refer Scheme Information Document of the scheme.
μ Dedicated Fund Manager for Overseas Investments: Mr. Miten Vora (managing fund since December 01, 2022)
Minimum Application Amount:
₹ 5,000 and in multiples of ₹ 1 thereafter.
Minimum Additional Application Amount:₹ 1,000 and in multiples of ₹ 1 thereafter
Minimum Application Amount:
(i) Daily, Weekly, Monthly SIP: ₹ 500/- and in multiples of
₹ 1/- thereafter;
(ii) Quarterly SIP: ₹ 1500/- and in multiples of ₹ 1/- thereafter.
There is no upper limit
Frequency Available:Daily, Weekly, Monthly and Quarterly
| Monthly AAUM## As On February 28, 2023 | : ₹ 3,172.50 Crores |
| AUM## As On February 28, 2023 | : ₹ 3,123.03 Crores |
## excluding inter-scheme Investments, if any, by other schemes of BNP Paribas Mutual Fund, as may be applicable
| EQUITY HOLDINGS | % of Net Assets | Derivatives |
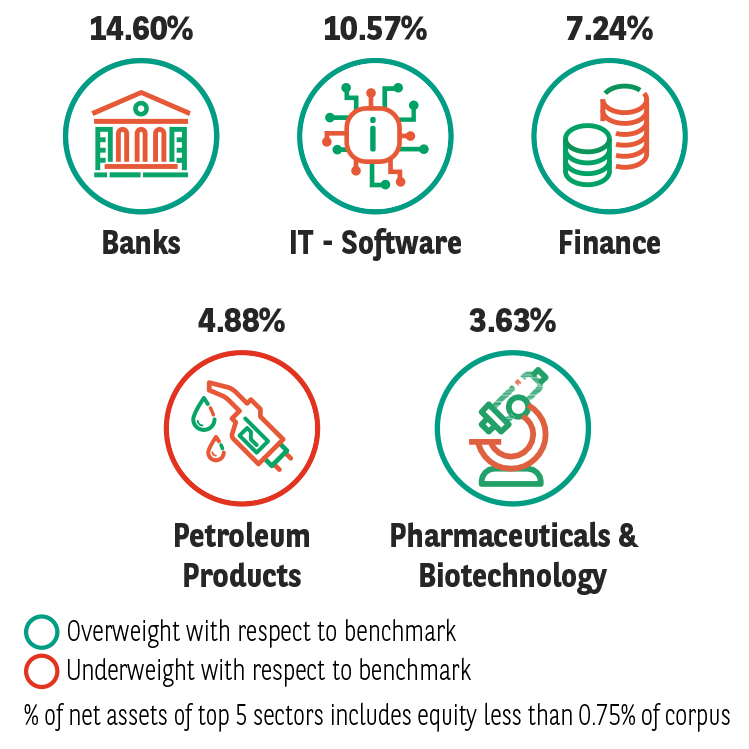
| BANKS | 14.01% | |
| ✔ HDFC Bank Ltd. | 4.46% | |
| ✔ ICICI Bank Ltd. | 3.56% | |
| IndusInd Bank Ltd. | 2.07% | |
| Bank of Baroda | 1.43% | |
| Axis Bank Ltd. | 1.41% | |
| RBL Bank Ltd. | 1.10% | |
| IT - SOFTWARE | 10.06% | |
| ✔ Tata Consultancy Services Ltd. | 3.82% | |
| ✔ Infosys Ltd. | 3.57% | |
| Coforge Ltd. | 1.51% | |
| Persistent Systems Ltd. | 1.15% | |
| FINANCE | 7.24% | |
| ✔ Housing Development Finance Corporation Ltd. | 4.60% | |
| Mahindra & Mahindra Financial Services Ltd. | 1.85% | |
| Housing Development Finance Corporation Ltd.(WARRANTS) | 0.79% | |
| PETROLEUM PRODUCTS | 4.46% | |
| ✔ Reliance Industries Ltd. | 4.46% | |
| PHARMACEUTICALS & BIOTECHNOLOGY | 3.33% | |
| ✔ Sun Pharmaceutical Industries Ltd. | 2.45% | |
| JB Chemicals & Pharmaceuticals Ltd. | 0.88% | |
| CONSTRUCTION | 2.85% | |
| ✔ Larsen & Toubro Ltd. | 2.85% | |
| DIVERSIFIED FMCG | 2.65% | |
| ✔ ITC Ltd. | 2.65% | |
| INDUSTRIAL PRODUCTS | 1.76% | |
| Cummins India Ltd. | 1.76% | |
| AUTO COMPONENTS | 1.43% | |
| UNO Minda Ltd. | 1.43% | |
| AEROSPACE & DEFENSE | 2.12% | |
| Bharat Electronics Ltd. | 2.12% | |
| ELECTRICAL EQUIPMENT | 2.08% | |
| Siemens Ltd. | 2.08% | |
| CONSUMER DURABLES | 2.01% | |
| Titan Company Ltd. | 2.01% | |
| AUTOMOBILES | 1.79% | |
| Maruti Suzuki India Ltd. | 1.79% | |
| POWER | 1.26% | |
| NTPC Ltd. | 1.26% | |
| TELECOM - SERVICES | 1.59% | |
| Bharti Airtel Ltd. | 1.59% | |
| PERSONAL PRODUCTS | 1.43% | |
| Dabur India Ltd. | 1.43% | |
| FERROUS METALS | 1.33% | |
| Tata Steel Ltd. | 1.33% | |
| CEMENT & CEMENT PRODUCTS | 1.06% | |
| Dalmia Bharat Ltd. | 1.06% | |
| REALTY | 0.98% | |
| Brigade Enterprises Ltd. | 0.98% | |
| AGRICULTURAL, COMMERCIAL & CONSTRUCTION VEHICLES | 0.93% | |
| Ashok Leyland Ltd. | 0.93% | |
| EQUITY LESS THAN 0.75% OF CORPUS | 5.91% | |
| Real Estate Investment Trust | 0.20% | |
| Embassy Office Parks Reit | 0.20% | |
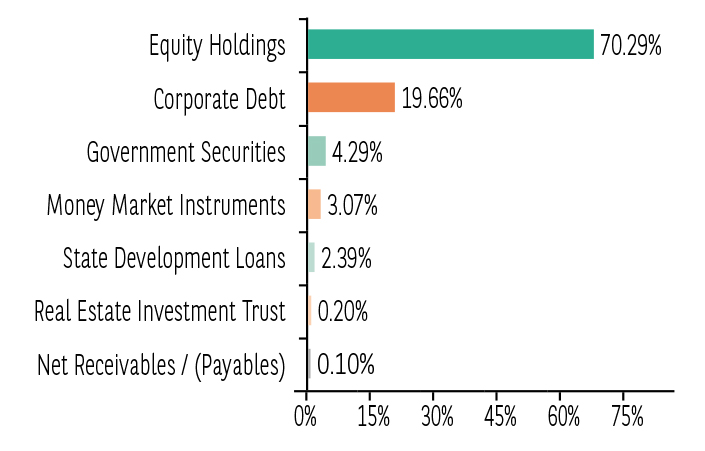
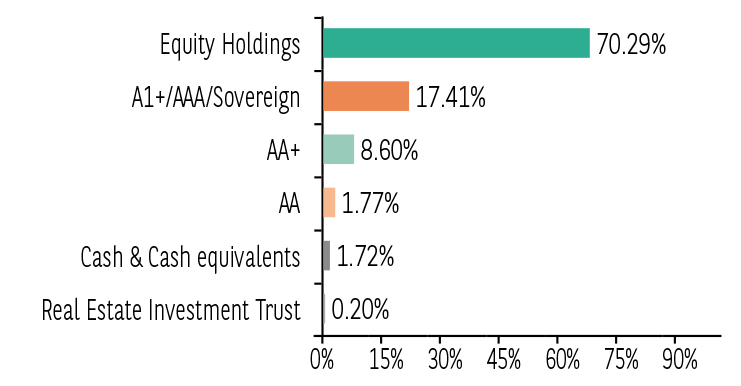
| Total Equity Holdings | 70.50% | |
| Fixed Income Holdings | Rating | % of Net Assets |
| Corporate Debt | 19.66% | |
| ✔ Torrent Power Ltd. | CRISIL AA+ | 2.97% |
| Embassy Office Parks Reit | CRISIL AAA | 1.81% |
| Shriram City Union Finance Ltd. | CRISIL AA+ | 1.38% |
| Bajaj Finance Ltd. | CRISIL AAA | 1.28% |
| Bharti Telecom Ltd. | CRISIL AA+ | 1.12% |
| Kotak Mahindra Prime Ltd. | CRISIL AAA | 1.12% |
| Shriram Housing Finance Ltd. | CRISIL AA+ | 0.96% |
| Bajaj Housing Finance Ltd. | CRISIL AAA | 0.79% |
| Muthoot Finance Ltd. | CRISIL AA+ | 0.73% |
| REC Ltd. | CRISIL AAA | 0.72% |
| HDFC Bank Ltd. | CRISIL AAA | 0.66% |
| Indian Railway Finance Corporation Ltd. | CRISIL AAA | 0.66% |
| Piramal Capital & Housing Finance Ltd. | [ICRA]AA | 0.61% |
| Axis Bank Ltd. | CRISIL AAA | 0.58% |
| Cholamandalam Investment & Finance Co. Ltd. | [ICRA]AA+ | 0.48% |
| Shriram Finance Ltd. | CRISIL AA+ | 0.47% |
| Manappuram Finance Ltd. | CRISIL AA | 0.47% |
| Nuvoco Vistas Corporation Ltd. | CRISIL AA | 0.41% |
| Small Industries Development Bank of India | [ICRA]AAA | 0.37% |
| Housing Development Finance Corporation Ltd. | CRISIL AAA | 0.33% |
| Shriram Housing Finance Ltd. | IND AA+ | 0.33% |
| Kotak Mahindra Bank Ltd. | CRISIL AAA | 0.30% |
| Motilal Oswal Home Finance Ltd. | CRISIL AA | 0.28% |
| Power Finance Corporation Ltd. | CRISIL AAA | 0.26% |
| Bank of Baroda( AT1 Bond under Basel III ) | CRISIL AA+ | 0.16% |
| National Bank for Agriculture and Rural Development | CRISIL AAA | 0.16% |
| Jamnagar Utilities & Power Private Ltd. | CRISIL AAA | 0.15% |
| FOOD Corporation of India | CRISIL AAA(CE) | 0.10% |
| Government Securities | 6.67% | |
| GOI FRB 7.42 22.09.2033 GOV | SOVEREIGN | 2.01% |
| GOI 5.22% 15.06.2025 GOV | SOVEREIGN | 1.08% |
| GOI FRB 7.69% 30.10.2034 GOV | SOVEREIGN | 0.78% |
| Uttar P 7.59% 25.10.2027 SDL | SOVEREIGN | 0.64% |
| Bihar 7.1% 14.12.2026 SDL | SOVEREIGN | 0.63% |
| Madhya P 7.4% 09.11.2026 SDL | SOVEREIGN | 0.48% |
| TAMILNADU 7.39% 09.11.2026 SDL | SOVEREIGN | 0.48% |
| GOI 7.17% 08.01.2028 GOV | SOVEREIGN | 0.32% |
| PUNJAB 09.72% 28.08.2023 SDL | SOVEREIGN | 0.16% |
| GOI 6.68% 17.09.2031 GOV | SOVEREIGN | 0.08% |
| GOI 07.88% 19.03.30 | SOVEREIGN | 0.02% |
| Money Market Instruments | 3.07% | |
| TREPS/Reverse Repo | 1.61% | |
| The Federal Bank Ltd. | CRISIL A1+ | 0.49% |
| L&T Finance Ltd. | CRISIL A1+ | 0.45% |
| IndusInd Bank Ltd. | CRISIL A1+ | 0.31% |
| State Bank of India | IND A1+ | 0.22% |
| Total Fixed Income Holdings | 29.40% | |
| Net Receivables / (Payables) | 0.10% | |
| GRAND TOTAL | 100.00% |
Investment in Top 10 scrips constitutes 35.39% of the portfolio
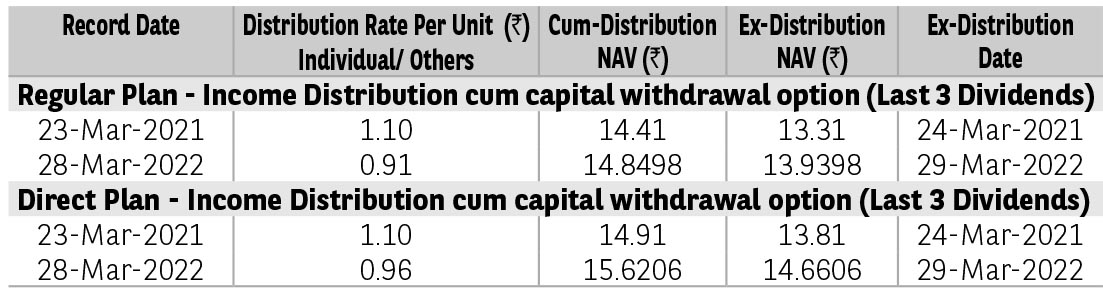
Pursuant to distribution under Income Distribution cum Capital Withdrawal (‘IDCW’) option, NAV of the IDCW option of the scheme(s) would fall to the extent of payout and statutory levy (if applicable). The
amounts under IDCW options can be distributed out of investors capital (Equalization Reserve), which is part of sale price that represents realized gains. Past performance may or may not be sustained in future.
The above stated distribution rate per unit is net distribution rate after deducting applicable taxes. The above distribution rates are on face value of ₹ 10 per unit.
| TER - Regular Plan (%) | 1.90 |
| TER - Direct Plan (%) | 0.64 |
| Portfolio Turnover Ratio | 1.69 |
| Standard Deviation* | 12.73% |
| Beta* | 1.05 |
| Sharpe Ratio* | 0.60 |
| Sharpe Ratio (annualised), Standard Deviation (annualised) and Beta are based on last 36 monthly data points. | |
* The information contained in this report has been obtained from sources considered to be authentic and reliable. This quantitative data does not purport to be an offer for purchase and sale of mutual fund units. The risk free rate of return considered for calculation of Sharpe ratio is 6.70%, as per 1 day MIBOR rate on the last business day of the month.
| Average Maturity (years) | 3.52 |
| Modified Duration (years) | 1.89 |
| YTM (%) | 8.08 |
| Macaulay Duration† (years) | 2.02 |
†Concept of Macaulay duration: The Macaulay Duration is a measure of a bond’s sensitivity to interest rate changes. It is expressed in annual terms. It is the weighted average term to maturity of the cash flows from a bond. The weight of each cash flow is determined by dividing the present value of the cash flow by the price. Factors like a bond’s price, maturity, coupon, yield to maturity among others impact the calculation of Macaulay duration.
Click here for Product label, Scheme riskometer and Benchmark riskometer.
Mutual Fund investments are subject to market risks, read all scheme related documents carefully.