(An open ended scheme investing in equity,
arbitrage and debt instruments)
(An open ended scheme investing in equity,
arbitrage and debt instruments)

The primary objective of the Scheme is to generate capital appreciation and income by using arbitrage opportunities, investment in equity / equity related instruments and debt/ money market instruments. However, there can be no assurance that the investment objectives of the Scheme will be realized. The Scheme does not guarantee/indicate any returns.
 NAV Details (As On February 28, 2023)
| Regular Plan - Growth Option | : ₹ 12.65 |
| Regular Plan - IDCW Option | : ₹ 11.88 |
| Direct Plan - Growth Option | : ₹ 13.15 |
| Direct Plan - IDCW Option | : ₹ 12.35 |
 Benchmark Index (Tier 1)
Nifty Equity Savings Index TRI
 Date of Allotment
July 25, 2019
 Fund Manager μ
| Category | Fund Manager | Managing fund since | Experience |
| Equity | Pratish Krishnan | 05-Sep-19 | 22 years |
| Fixed Income | Mayank Prakash | 14-Mar-22 | 15 years |
 Load Structure
Entry Load
Exit Load: If units are redeemed upto 10% of the units held, on or before one year from the date of allotment : Nil.; If units are redeemed over and above the 10% limit, on or before one year from the date of allotment : 1% of the applicable Net Asset Value (NAV); If units are redeemed after one year from the date of allotment: Nil
The above Exit Load will be applicable to all subscription transactions, excluding switch-ins.
For detailed load structure please refer Scheme Information Document of the scheme
μ Dedicated Fund Manager for Overseas Investments: Mr. Miten Vora (managing fund since December 01, 2022)
Minimum Application Amount:
₹ 5,000 and in multiples of ₹ 1 thereafter.
Minimum Additional Application Amount:₹ 1,000 and in multiples of ₹ 1 thereafter
Minimum Application Amount:
(i) Daily, Weekly, Monthly SIP: ₹ 500/- and in multiples of
₹ 1/- thereafter;
(ii) Quarterly SIP: ₹ 1500/- and in multiples of ₹ 1/- thereafter.
There is no upper limit
Frequency Available:Daily, Weekly, Monthly and Quarterly
| Monthly AAUM## As On February 28, 2023 | : ₹ 254.00 Crores |
| AUM## As On February 28, 2023 | : ₹ 250.23 Crores |
## excluding inter-scheme Investments, if any, by other schemes of BNP Paribas Mutual Fund, as may be applicable
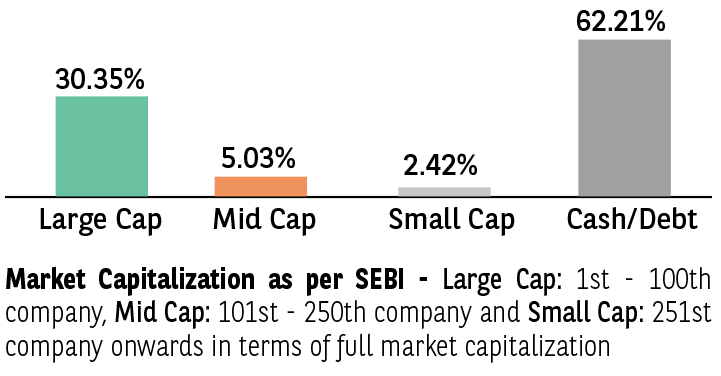
| EQUITY HOLDINGS | % of Net Assets | Derivatives |
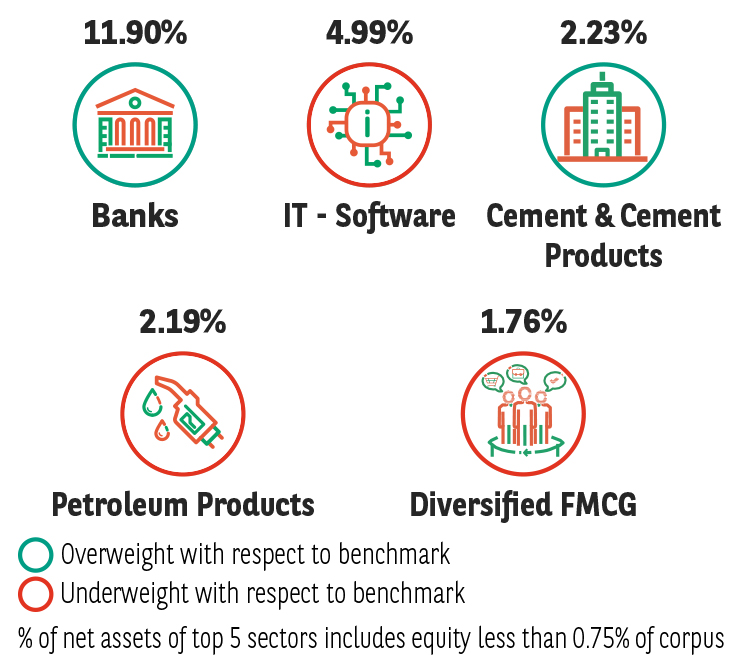
| BANKS | 11.40% | |
| ✔ HDFC Bank Ltd. | 9.64% | -4.21% |
| ✔ ICICI Bank Ltd. | 6.32% | -3.53% |
| State Bank of India | 1.51% | |
| IndusInd Bank Ltd. | 0.88% | |
| Axis Bank Ltd. | 0.78% | |
| IT - SOFTWARE | 4.52% | |
| Infosys Ltd. | 2.04% | |
| Tata Consultancy Services Ltd. | 1.68% | -0.86% |
| HCL Technologies Ltd. | 0.87% | |
| Coforge Ltd. | 0.79% | |
| CEMENT & CEMENT PRODUCTS | 1.55% | |
| Ultratech Cement Ltd. | 1.55% | |
| PETROLEUM PRODUCTS | 2.19% | |
| ✔ Reliance Industries Ltd. | 8.16% | -5.97% |
| DIVERSIFIED FMCG | 1.76% | |
| Hindustan Unilever Ltd. | 2.05% | -1.07% |
| ITC Ltd. | 0.78% | |
| CONSTRUCTION | 1.33% | |
| Larsen & Toubro Ltd. | 1.33% | |
| AUTOMOBILES | 0.81% | |
| ✔ Maruti Suzuki India Ltd. | 3.52% | -2.71% |
| FINANCE | -0.01% | |
| ✔ Housing Development Finance Corporation Ltd. | 2.97% | -2.99% |
| TELECOM - SERVICES | 1.15% | |
| Bharti Airtel Ltd. | 1.15% | |
| PHARMACEUTICALS & BIOTECHNOLOGY | 1.06% | |
| ✔ Sun Pharmaceutical Industries Ltd. | 2.60% | -1.54% |
| ELECTRICAL EQUIPMENT | 1.04% | |
| Siemens Ltd. | 1.04% | |
| PERSONAL PRODUCTS | 0.92% | |
| Dabur India Ltd. | 0.92% | |
| AUTO COMPONENTS | 0.89% | |
| Schaeffler India Ltd. | 0.89% | |
| POWER | -0.01% | |
| ✔ Tata Power Company Ltd. | 2.08% | -2.08% |
| FERROUS METALS | 0.49% | |
| Tata Steel Ltd. | 1.78% | -1.29% |
| CONSUMABLE FUELS | 0.00% | |
| Coal India Ltd. | 1.16% | -1.15% |
| EQUITY LESS THAN 0.75% OF CORPUS | 9.67% | -0.97% |
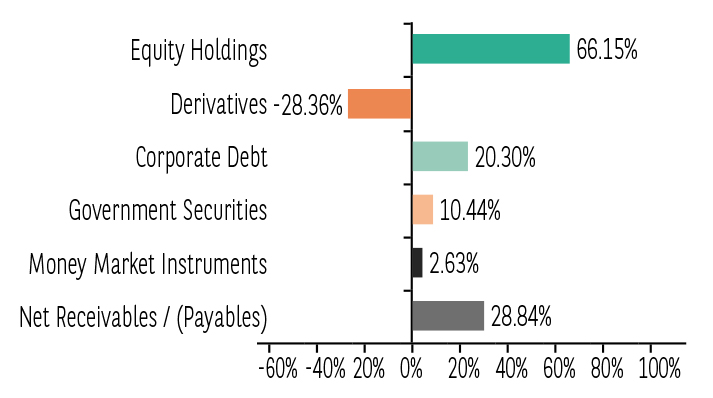
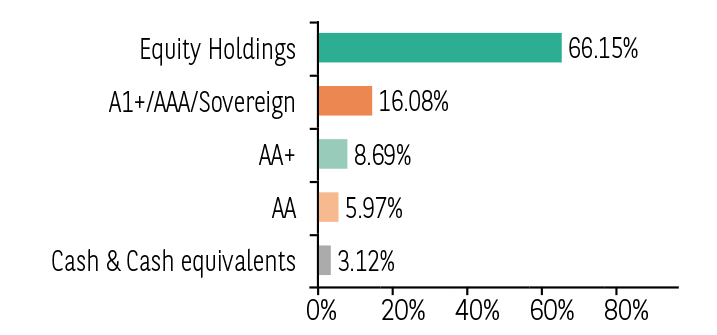
| Total Equity Holdings | 66.15% | -28.36% |
| Fixed Income Holdings | Rating | % of Net Assets |
| Corporate Debt | 20.30% | |
| ✔ JM Financial Products Ltd. | [ICRA]AA | 2.35% |
| HDFC Bank Ltd. | CRISIL AAA | 2.05% |
| Bharti Telecom Ltd. | CRISIL AA+ | 2.00% |
| Hero FinCorp Ltd. | CRISIL AA+ | 2.00% |
| Piramal Capital & Housing Finance Ltd. | [ICRA]AA | 2.00% |
| Kotak Mahindra Investments Ltd. | CRISIL AAA | 1.99% |
| Shriram Finance Ltd. | CRISIL AA+ | 1.97% |
| Torrent Power Ltd. | CRISIL AA+ | 1.94% |
| Housing and Urban Development Corporation Ltd. | [ICRA]AAA | 1.59% |
| Motilal Oswal Home Finance Ltd. | CRISIL AA | 0.82% |
| JSW Steel Ltd. | IND AA | 0.80% |
| Can Fin Homes Ltd. | [ICRA]AA+ | 0.78% |
| Britannia Industries Ltd. | CRISIL AAA | 0.00% |
| Yes Bank Ltd. | [ICRA]D | 0.00% |
| Government Securities | 10.44% | |
| ✔ GOI 5.63% 12.04.2026 GOV | SOVEREIGN | 5.71% |
| ✔ GOI 5.74% 15.11.2026 GOV | SOVEREIGN | 2.84% |
| GOI 5.15% 09.11.2025 GOV | SOVEREIGN | 1.89% |
| Money Market Instruments | 2.63% | |
| TREPS/Reverse Repo | 2.63% | |
| Total Fixed Income Holdings | 33.37% | |
| Net Receivables / (Payables) | 0.48% | |
| GRAND TOTAL | 100.00% |
Investment in Top 10 scrips constitutes 46.18% of the portfolio
Net equity holdings is 37.79% of the portfolio
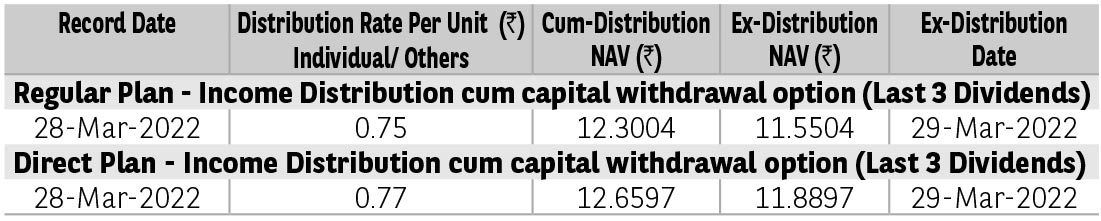
Pursuant to distribution under Income Distribution cum Capital Withdrawal (‘IDCW’) option, NAV of the IDCW option of the scheme(s) would fall to the extent of payout and statutory levy (if applicable). The
amounts under IDCW options can be distributed out of investors capital (Equalization Reserve), which is part of sale price that represents realized gains. Past performance may or may not be sustained in future.
The above stated distribution rate per unit is net distribution rate after deducting applicable taxes. The above distribution rates are on face value of ₹ 10 per unit.
| TER - Regular Plan (%) | 2.51 |
| TER - Direct Plan (%) | 1.45 |
| Portfolio Turnover Ratio | 4.94 |
| Standard Deviation* | 5.64% |
| Beta* | 0.64 |
| Sharpe Ratio* | 0.01 |
| Sharpe Ratio (annualised), Standard Deviation (annualised) and Beta are based on last 36 monthly data points. | |
*The information contained in this report has been obtained from sources considered to be authentic and reliable. This quantitative data does not purport to be an offer for purchase and sale of mutual fund units. The risk free rate of return considered for calculation of Sharpe ratio is 6.70%, as per 1 day MIBOR rate on the last business day of the month.
| Average Maturity (years) | 2.41 |
| Modified Duration (years) | 2.04 |
| YTM (%) | 8.01 |
| Macaulay Duration† (years) | 2.17 |
†Concept of Macaulay duration: The Macaulay Duration is a measure of a bond’s sensitivity to interest rate changes. It is expressed in annual terms. It is the weighted average term to maturity of the cash flows from a bond. The weight of each cash flow is determined by dividing the present value of the cash flow by the price. Factors like a bond’s price, maturity, coupon, yield to maturity among others impact the calculation of Macaulay duration.
Click here for Product label, Scheme riskometer and Benchmark riskometer.
Mutual Fund investments are subject to market risks, read all scheme related documents carefully.