(An Open ended Equity Linked Saving Scheme with
a statutory lock in of 3 years and tax benefit)
(An Open ended Equity Linked Saving Scheme with
a statutory lock in of 3 years and tax benefit)

The investment objective of the Scheme is to generate long-term capital growth from a diversified and actively managed portfolio of equity and equity related securities along with income tax rebate, as may be prevalent from time to time. However, there can be no assurance that the investment objectives of the Scheme will be realized. The Scheme does not guarantee/indicate any returns.
 NAV Details (As On February 28, 2023)
| Regular Plan - Growth Option | : ₹ 56.417 |
| Regular Plan - IDCW Option | : ₹ 17.682 |
| Direct Plan - Growth Option | : ₹ 61.795 |
| Direct Plan - IDCW Option | : ₹ 21.807 |
 Benchmark Index (Tier 1)
Nifty 500 Total Return Index (TRI)
 Date of Allotment
January 05, 2006
 Fund Manager μ
| Fund Manager | Managing fund since | Experience |
| Sanjay Chawla | 14-Mar-22 | 33 years |
| Pratish Krishnan | 14-Mar-22 | 22 years |
 Load Structure
Entry Load: Not Applicable
Exit Load: Nil
μ Dedicated Fund Manager for Overseas Investments: Mr. Miten Vora (managing fund since December 01, 2022)
Minimum Application Amount:
₹ 500 and in multiples of
₹ 500 thereafter.
Minimum Additional Application Amount:₹ 500 and in
multiples of ₹ 500 thereafter.
Minimum Application Amount:
(i) Daily, Weekly, Monthly SIP: ₹ 500/- and in multiples of
₹ 500/- thereafter;
(ii) Quarterly SIP: ₹ 500/- and in multiples of ₹ 500/-
thereafter on a quarterly basis by providing for a minimum
of 4 installments.
Frequency Available:Daily, Weekly, Monthly and Quarterly
| Monthly AAUM## As On February 28, 2023 | : ₹ 665.94 Crores |
| AUM## As On February 28, 2023 | : ₹ 651.98 Crores |
## excluding inter-scheme Investments, if any, by other schemes of Baroda BNP Paribas Mutual Fund, as may be applicable
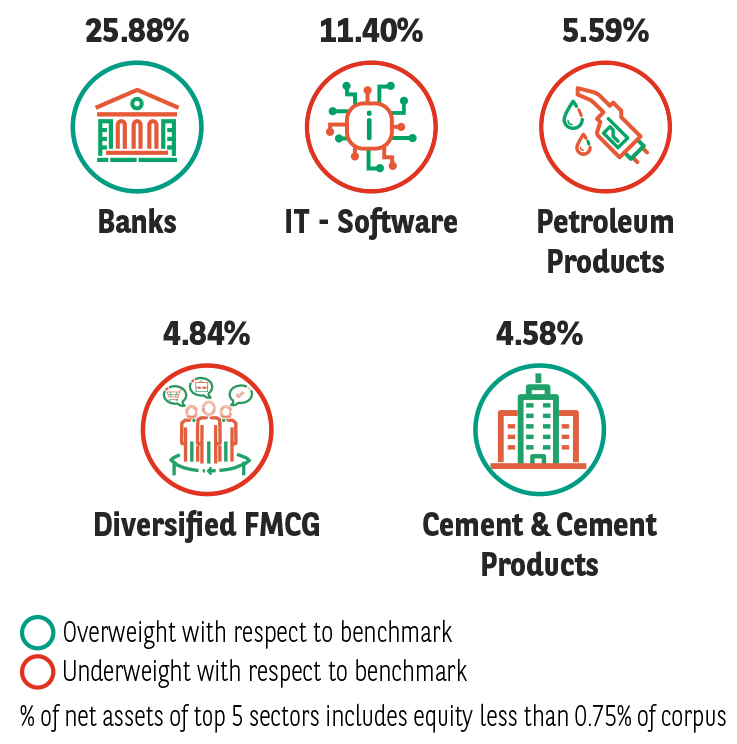
| EQUITY HOLDINGS | % of Net Assets |
| BANKS | 25.16% |
| ✔ HDFC Bank Ltd. | 8.96% |
| ✔ ICICI Bank Ltd. | 7.13% |
| ✔ State Bank of India | 3.85% |
| IndusInd Bank Ltd. | 2.17% |
| Axis Bank Ltd. | 1.54% |
| Karur Vysya Bank Ltd. | 1.52% |
| IT - SOFTWARE | 11.40% |
| ✔ Infosys Ltd. | 4.11% |
| ✔ Tata Consultancy Services Ltd. | 3.68% |
| HCL Technologies Ltd. | 2.07% |
| Coforge Ltd. | 1.54% |
| PETROLEUM PRODUCTS | 5.59% |
| ✔ Reliance Industries Ltd. | 5.59% |
| DIVERSIFIED FMCG | 4.84% |
| ✔ Hindustan Unilever Ltd. | 2.59% |
| ✔ ITC Ltd. | 2.25% |
| CEMENT & CEMENT PRODUCTS | 4.58% |
| ✔ Ultratech Cement Ltd. | 3.59% |
| Dalmia Bharat Ltd. | 0.98% |
| FINANCE | 4.50% |
| Five Star Business Finance LTD | 1.96% |
| Housing Development Finance Corporation Ltd. | 1.48% |
| Bajaj Finserv Ltd. | 1.06% |
| AUTO COMPONENTS | 3.56% |
| Schaeffler India Ltd. | 2.15% |
| UNO Minda Ltd. | 1.41% |
| PHARMACEUTICALS & BIOTECHNOLOGY | 4.19% |
| Sun Pharmaceutical Industries Ltd. | 1.98% |
| JB Chemicals & Pharmaceuticals Ltd. | 1.25% |
| Cipla Ltd. | 0.96% |
| INDUSTRIAL PRODUCTS | 3.62% |
| KEI Industries Ltd. | 1.50% |
| Timken India Ltd. | 1.28% |
| Cummins India Ltd. | 0.84% |
| AUTOMOBILES | 3.34% |
| Maruti Suzuki India Ltd. | 1.72% |
| Mahindra & Mahindra Ltd. | 1.62% |
| CONSTRUCTION | 2.96% |
| ✔ Larsen & Toubro Ltd. | 2.96% |
| REALTY | 2.81% |
| The Phoenix Mills Ltd. | 1.42% |
| Brigade Enterprises Ltd. | 1.38% |
| POWER | 2.71% |
| NLC India Ltd. | 1.69% |
| NHPC Ltd. | 1.02% |
| TELECOM - SERVICES | 2.07% |
| Bharti Airtel Ltd. | 2.07% |
| CONSUMER DURABLES | 1.97% |
| Titan Company Ltd. | 1.09% |
| Blue Star Ltd. | 0.88% |
| ELECTRICAL EQUIPMENT | 1.86% |
| Siemens Ltd. | 1.86% |
| LEISURE SERVICES | 1.72% |
| The Indian Hotels Company Ltd. | 1.72% |
| AGRICULTURAL, COMMERCIAL & CONSTRUCTION VEHICLES | 1.70% |
| Ashok Leyland Ltd. | 1.70% |
| RETAILING | 1.60% |
| Trent Ltd. | 1.60% |
| CHEMICALS & PETROCHEMICALS | 1.24% |
| Linde India Ltd. | 1.24% |
| ENTERTAINMENT | 1.02% |
| PVR Ltd. | 1.02% |
| FERTILIZERS & AGROCHEMICALS | 0.86% |
| Sumitomo Chemical India Ltd. | 0.86% |
| EQUITY LESS THAN 0.75% OF CORPUS | 3.34% |
| Total Equity Holdings | 96.64% |
| Fixed Income Holdings | % of Net Assets |
| Money Market Instruments | 3.40% |
| TREPS/Reverse Repo | 3.40% |
| Total Fixed Income Holdings | 3.40% |
| Net Receivables / (Payables) | -0.04% |
| GRAND TOTAL | 100.00% |
Investment in Top 10 scrips constitutes 44.71% of the portfolio
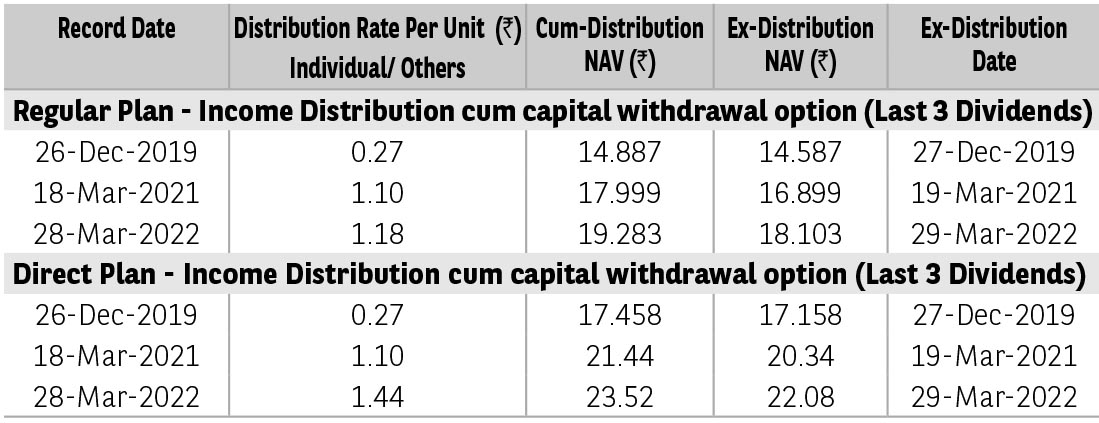
Pursuant to distribution under Income Distribution cum Capital Withdrawal (‘IDCW’) option, NAV of the IDCW option of the scheme(s) would fall to the extent of payout and statutory levy (if applicable). The
amounts under IDCW options can be distributed out of investors capital (Equalization Reserve), which is part of sale price that represents realized gains. Past performance may or may not be sustained in future.
The above stated distribution rate per unit is net distribution rate after deducting applicable taxes. The above distribution rates are on face value of ₹ 10 per unit.
| TER - Regular Plan (%) | 2.33 |
| TER - Direct Plan (%) | 1.12 |
| Portfolio Turnover Ratio | 0.84 |
| Standard Deviation* †† | 19.54% |
| Beta* †† | 0.85 |
| Sharpe Ratio* †† | 0.32 |
| Sharpe Ratio (annualised), Standard Deviation (annualised) and Beta are based on last 36 monthly data points. | |
| †† The scheme is a ‘Transferee Scheme’, and accordingly, the ratios are being provided considering the weighted average NAVs of both the Transferor Scheme and Transferee Scheme. | |
* The information contained in this report has been obtained from sources considered to be authentic and reliable. This quantitative data does not purport to be an offer for purchase and sale of mutual fund units. The risk free rate of return considered for calculation of Sharpe ratio is 6.70%, as per 1 day MIBOR rate on the last business day of the month.
Click here for Product label, Scheme riskometer and Benchmark riskometer.
Mutual Fund investments are subject to market risks, read all scheme related documents carefully.