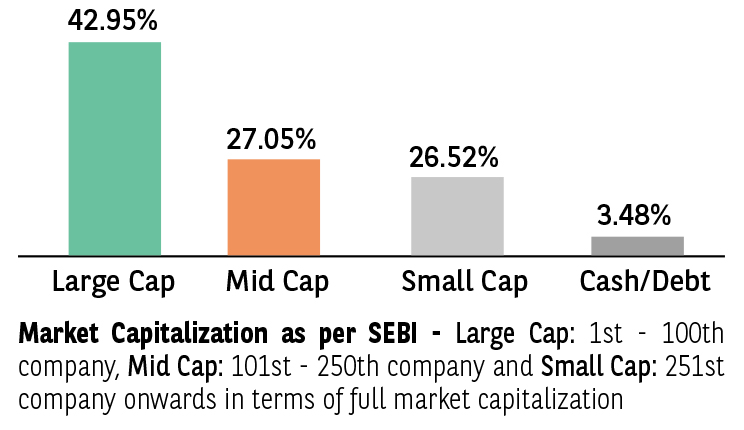
(An open ended equity scheme investing across
large cap, mid-cap and small cap stocks)
(An open ended equity scheme investing across
large cap, mid-cap and small cap stocks)

The investment objective is to generate long term capital appreciation from an actively managed portfolio of equity & equity related instruments. However, there can be no assurance that the investment objectives of the Scheme will be realized. The Scheme does not guarantee/indicate any returns.
 NAV Details ( As On February 28, 2023 )
| Regular Plan - Growth Option | : ₹ 168.187 |
| Regular Plan - IDCW Option | : ₹ 39.555 |
| Direct Plan - Growth Option | : ₹ 184.191 |
| Direct Plan - IDCW Option | : ₹ 40.962 |
 Benchmark Index (Tier 1)
Nifty 500 Multicap 50:25:25 TRI
 Date of Allotment
September 12, 2003
 Fund Manager μ
| Fund Manager | Managing fund since | Experience |
| Sanjay Chawla | 01-Nov-15 | 33 years |
| Sandeep Jain | 14-Mar-22 | 14 years |
 Load Structure
Entry Load: Not Applicable
Exit Load: 1% if redeemed on or before 12 months from the
date of allotment of units. • NIL if redeemed after 12 months
from the date of allotment of units.
For detailed load structure please refer Scheme Information
Document of the scheme.
Minimum Application Amount:
₹ 5,000 and in multiples of ₹ 1
thereafter.
Minimum Additional Application Amount:₹ 1,000 and in
multiples of ₹ 1 thereafter.
Minimum Application Amount:
(i) Daily, Weekly, Monthly SIP: ₹ 500/- and in multiples of
₹ 1/- thereafter;
(ii) Quarterly SIP: ₹ 1500/- and in multiples of ₹ 1/- thereafter. There is no upper limit
Frequency Available:Daily, Weekly, Monthly and Quarterly
| Monthly AAUM## As On February 28, 2023 | : ₹ 1,660.55 Crores |
| AUM## As On February 28, 2023 | : ₹ 1,628.82 Crores |
## excluding inter-scheme Investments, if any, by other schemes of Baroda BNP Paribas Mutual Fund, as may be applicable
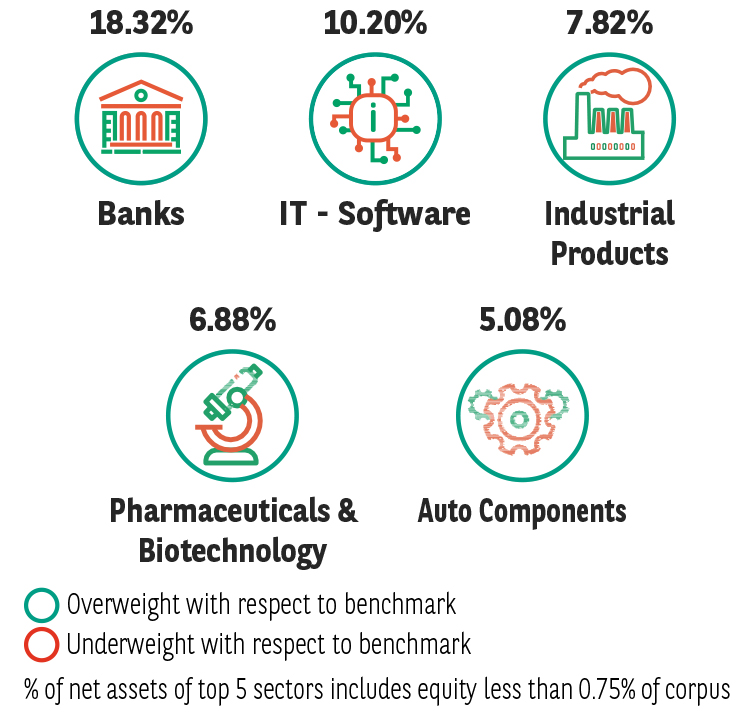
| EQUITY HOLDINGS | % of Net Assets |
| BANKS | 18.32% |
| ✔ HDFC Bank Ltd. | 4.66% |
| ✔ ICICI Bank Ltd. | 4.54% |
| State Bank of India | 2.09% |
| Bank of Baroda | 1.95% |
| AU Small Finance Bank Ltd. | 1.95% |
| RBL Bank Ltd. | 1.67% |
| IndusInd Bank Ltd. | 1.46% |
| IT - SOFTWARE | 10.20% |
| ✔ Tata Consultancy Services Ltd. | 2.91% |
| ✔ Infosys Ltd. | 2.10% |
| Persistent Systems Ltd. | 2.02% |
| Coforge Ltd. | 1.79% |
| KPIT Technologies Ltd. | 1.38% |
| INDUSTRIAL PRODUCTS | 7.82% |
| Ratnamani Metals & Tubes Ltd. | 1.95% |
| KEI Industries Ltd. | 1.83% |
| Carborundum Universal Ltd. | 1.64% |
| Timken India Ltd. | 1.22% |
| APL Apollo Tubes Ltd. | 1.18% |
| PHARMACEUTICALS & BIOTECHNOLOGY | 6.88% |
| ✔ Sun Pharmaceutical Industries Ltd. | 2.88% |
| ✔ JB Chemicals & Pharmaceuticals Ltd. | 2.67% |
| Indoco Remedies Ltd. | 1.33% |
| AUTO COMPONENTS | 5.08% |
| Schaeffler India Ltd. | 1.67% |
| UNO Minda Ltd. | 1.45% |
| Sundram Fasteners Ltd. | 1.18% |
| Mahindra CIE Automotive Ltd. | 0.78% |
| PETROLEUM PRODUCTS | 3.92% |
| ✔ Reliance Industries Ltd. | 3.92% |
| CEMENT & CEMENT PRODUCTS | 3.38% |
| Dalmia Bharat Ltd. | 2.04% |
| Ultratech Cement Ltd. | 1.34% |
| HEALTHCARE SERVICES | 3.35% |
| Rainbow Children's Medicare Ltd. | 2.05% |
| Fortis Healthcare Ltd. | 1.31% |
| REALTY | 3.30% |
| Brigade Enterprises Ltd. | 1.84% |
| The Phoenix Mills Ltd. | 1.46% |
| AUTOMOBILES | 3.16% |
| ✔ Mahindra & Mahindra Ltd. | 2.10% |
| Maruti Suzuki India Ltd. | 1.06% |
| FINANCE | 2.89% |
| ✔ Five Star Business Finance LTD | 2.13% |
| Housing Development Finance Corporation Ltd.(WARRANTS) | 0.76% |
| ELECTRICAL EQUIPMENT | 2.88% |
| Hitachi Energy India Ltd. | 1.59% |
| Siemens Ltd. | 1.30% |
| CONSUMER DURABLES | 2.69% |
| Blue Star Ltd. | 1.52% |
| VIP Industries Ltd. | 1.17% |
| LEISURE SERVICES | 2.29% |
| ✔ The Indian Hotels Company Ltd. | 2.29% |
| FOOD PRODUCTS | 2.24% |
| Nestle India Ltd. | 1.15% |
| Britannia Industries Ltd. | 1.10% |
| ENTERTAINMENT | 2.10% |
| PVR Ltd. | 2.10% |
| AGRICULTURAL, COMMERCIAL & CONSTRUCTION VEHICLES | 2.05% |
| Ashok Leyland Ltd. | 2.05% |
| CHEMICALS & PETROCHEMICALS | 1.33% |
| Linde India Ltd. | 1.33% |
| POWER | 1.68% |
| NHPC Ltd. | 1.68% |
| BEVERAGES | 1.64% |
| Radico Khaitan Ltd. | 1.64% |
| FERTILIZERS & AGROCHEMICALS | 1.43% |
| PI Industries Ltd. | 1.43% |
| DIVERSIFIED FMCG | 1.39% |
| ITC Ltd. | 1.39% |
| CONSTRUCTION | 1.36% |
| Larsen & Toubro Ltd. | 1.36% |
| FERROUS METALS | 1.28% |
| Tata Steel Ltd. | 1.28% |
| GAS | 1.10% |
| GAIL (India) Ltd. | 1.10% |
| TELECOM - SERVICES | 1.09% |
| Bharti Airtel Ltd. | 1.09% |
| INSURANCE | 1.06% |
| Max Financial Services Ltd. | 1.06% |
| EQUITY LESS THAN 0.75% OF CORPUS | 0.62% |
| Total Equity Holdings | 96.52% |
| Fixed Income Holdings | % of Net Assets |
| Money Market Instruments | 3.40% |
| TREPS/Reverse Repo | 3.40% |
| Total Fixed Income Holdings | 3.40% |
| Net Receivables / (Payables) | 0.09% |
| GRAND TOTAL | 100.00% |
Investment in Top 10 scrips constitutes 30.21% of the portfolio
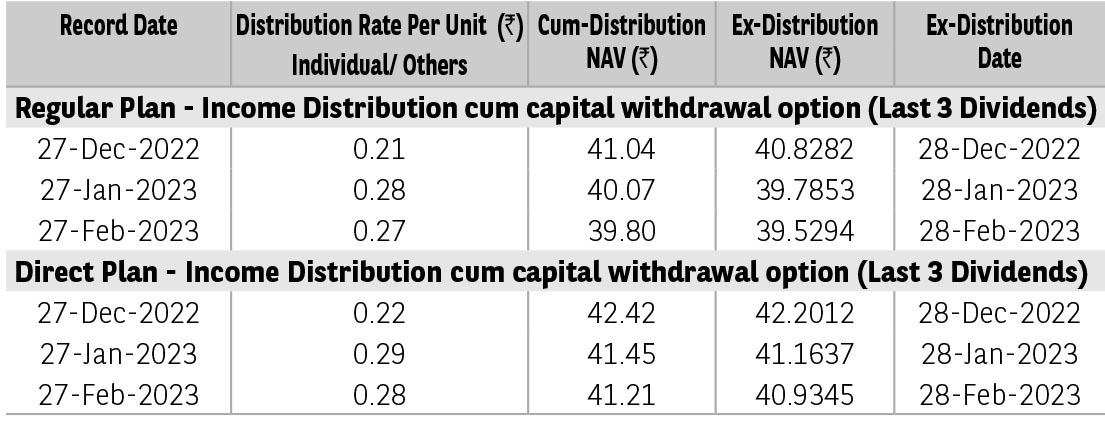
Pursuant to distribution under Income Distribution cum Capital Withdrawal (‘IDCW’) option, NAV of the IDCW option of the scheme(s) would fall to the extent of payout and statutory levy (if applicable). The
amounts under IDCW options can be distributed out of investors capital (Equalization Reserve), which is part of sale price that represents realized gains. Past performance may or may not be sustained in future.
The above stated distribution rate per unit is net distribution rate after deducting applicable taxes. The above distribution rates are on face value of ₹ 10 per unit.
| TER - Regular Plan (%) | 2.22 |
| TER - Direct Plan (%) | 1.10 |
| Portfolio Turnover Ratio | 0.77 |
| Standard Deviation*†† | 21.33% |
| Beta*†† | 0.85 |
| Sharpe Ratio*†† | 0.54 |
| Sharpe Ratio (annualised), Standard Deviation (annualised) and Beta are based on last 36 monthly data points. | |
| †† The scheme is a ‘Transferee Scheme’, and accordingly, the ratios are being provided considering the weighted average NAVs of both the Transferor Scheme and Transferee Scheme. | |
* The information contained in this report has been obtained from sources considered to be authentic and reliable. This quantitative data does not purport to be an offer for purchase and sale of mutual fund units. The risk free rate of return considered for calculation of Sharpe ratio is 6.70%, as per 1 day MIBOR rate on the last business day of the month.
Click here for Product label, Scheme riskometer and Benchmark riskometer.
Mutual Fund investments are subject to market risks, read all scheme related documents carefully.